What is the most important number your senior leadership and CEO pay close attention to at your organization — and do they know why?
Every senior leader has at least one key metric they pay close attention to, and they are crystal clear as to why. The “why” may vary for each metric, such as measuring success, predicting results, mitigating risk, or some combination of all these.
One example found at for-profit businesses is EBITDA (earnings before interest, taxes, depreciation and amortization). This metric is often used to assess an organization’s financial performance.
Though it’s not a perfect metric and has its critics, the “why” is because many senior leaders pay close attention to it year over year to forecast earning potential.
The Total Health Index (THI) is a new metric for senior leaders. It’s a behavioural-based metric that senior leaders can put on their scorecard for tracking and predicting human capital health, engagement, productivity, costs and profitability per employee.
And when considering the benefits of this metric, the why becomes obvious.
The THI is for leaders who:
- believe their success is dependent on their people being able and willing to come to work each day and do their best work (when they don’t or can’t, the organization’s results are negatively impacted)
- believe there are direct relationships between employee health, engagement and productivity
- believe that organizations play a critical role in facilitating every employee’s success (for example, their workplace experience), and think that all employees ultimately own their behaviour in the workplace and outside work (for example, physical, mental and life/financial)
- want to evaluate and measure the benefit of program dollars when it comes to employees’ health, engagement and productivity, using an evidence-based framework
- want to be able to benchmark their workforce against other Canadian organizations, by size or sector, with respect to health, engagement and productivity.
Before any senior leader can answer the why question for this metric, they need to learn its significance and what it is.
This metric is generated from employees completing the Total Health Index Assessment (see “The 4 pillars of the Total Health Index” in the March issue of Canadian HR Reporter).
The following tools can be used to reach the THI metric: discovery, insight and employee-recommended workplace award. Beyond providing the THI score, each tool delivers a different level of analysis and insight.
The THI is a composite score derived from the sum of four sub-pillar scores: physical health, mental health, workplace experience and life (meaning relationships, work-life blending and financial). The score ranges from zero to 100 per cent. The higher the score and the higher the organization’s aggregated THI score, the higher the total health.
Before accepting a THI score, statistical analyses are used to ensure the organization’s sample size is significant enough to provide confidence that it accurately represents the workforce.
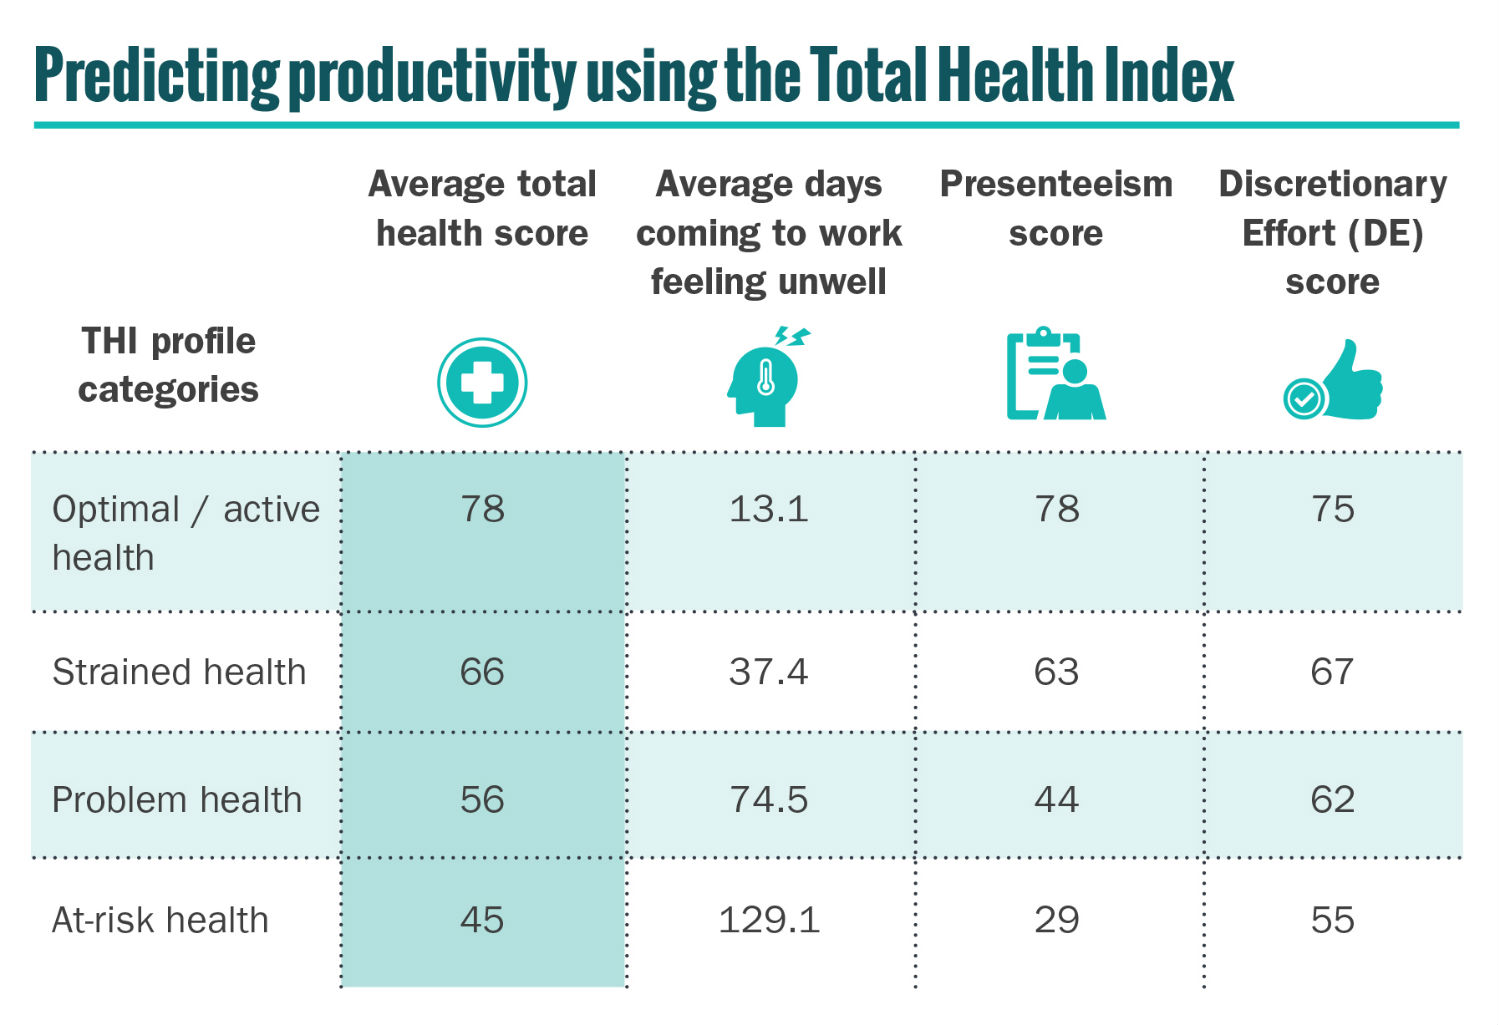
Every employee’s score is put into one of five categories: optimal health, active health, strained health, problem health and at-risk health.
Productivity insights learned from examining the THI metric
When we compare the THI profile categories in the chart above to three key performance behaviours — average number of days coming to work feeling ill, presenteeism score, and discretionary effort score — employees with a lower THI score are less productive.
The THI score can also be used to predict employee risk levels for sick days, short-term disability (STD), long-term disability (LTD), and workers’ compensation claims.
Using a lost-time salary analysis, it’s straightforward to estimate the average cost in each of the THI profile categories with respect to productivity, as well as with engagement (for example, turnover risk and engagement sustainability), health (for example, the number of chronic diseases and risk for obesity, mental illness, addictive behaviours and accidents).
The productivity analysis is a favourite analytic for the CHRO, COO, CFO and CEO because it provides statistical, defendable links among employees’ health, engagement, productivity and financial results (both lost opportunity and cost).
Our research has found that 46 per cent of the Canadian workforce falls in the bottom three categories (strained health, problem health and at-risk health).
Consider an organization whose THI score falls in the strained health category compared to one in the optimal/active health range. The “Predicting productivity” chart above demonstrates the opportunity and ROI factors for consideration when committing to make an investment to improve an organization’s THI score.
Bill Howatt, Ph.D. Ed.D., is the chief of research and development, workforce productivity, at Morneau Shepell in Toronto. For more information about the Total Health Index, visit
www.morneaushepell.com.