Canada’s labour market continues to be selective: available jobs, i.e., vacancies again fell this month, from 525,185 (November 2024) to 465,750 (November 2025) even as payroll employment edged up from 17.53 million to 17.61 million, pushing the burden onto tighter requisition control rather than headline layoffs.

Strategic HR, February 2026 Edition
Available jobs keep falling, utilities wages and hiring raises all boats, Quebec transport and unions drive HR risk
Canada’s labour market continues to be selective: available jobs, i.e., vacancies again fell this month, from 525,185 (November 2024) to 465,750 (November 2025) even as payroll employment edged up from 17.53 million to 17.61 million, pushing the burden onto tighter requisition control rather than headline layoffs.
Utilities is the month’s clearest competitive signal, leading vacancy growth (+16.1 percent; 1,425 to 1,655) and again topping wage growth ($51.28 to $55, +7.3 percent). This is a direct warning for any employer sharing safety-critical talent pools.
Tribunal risk is sharpening around enforcement and unions: the Quebec Transportation Board rose +43 cases, while the Ontario Labour Relations Board increased +34, with files dominated by representation votes and procedural mechanics.
Strategic HR: January Edition
1. Job vacancies
1.A. National job vacancy trends
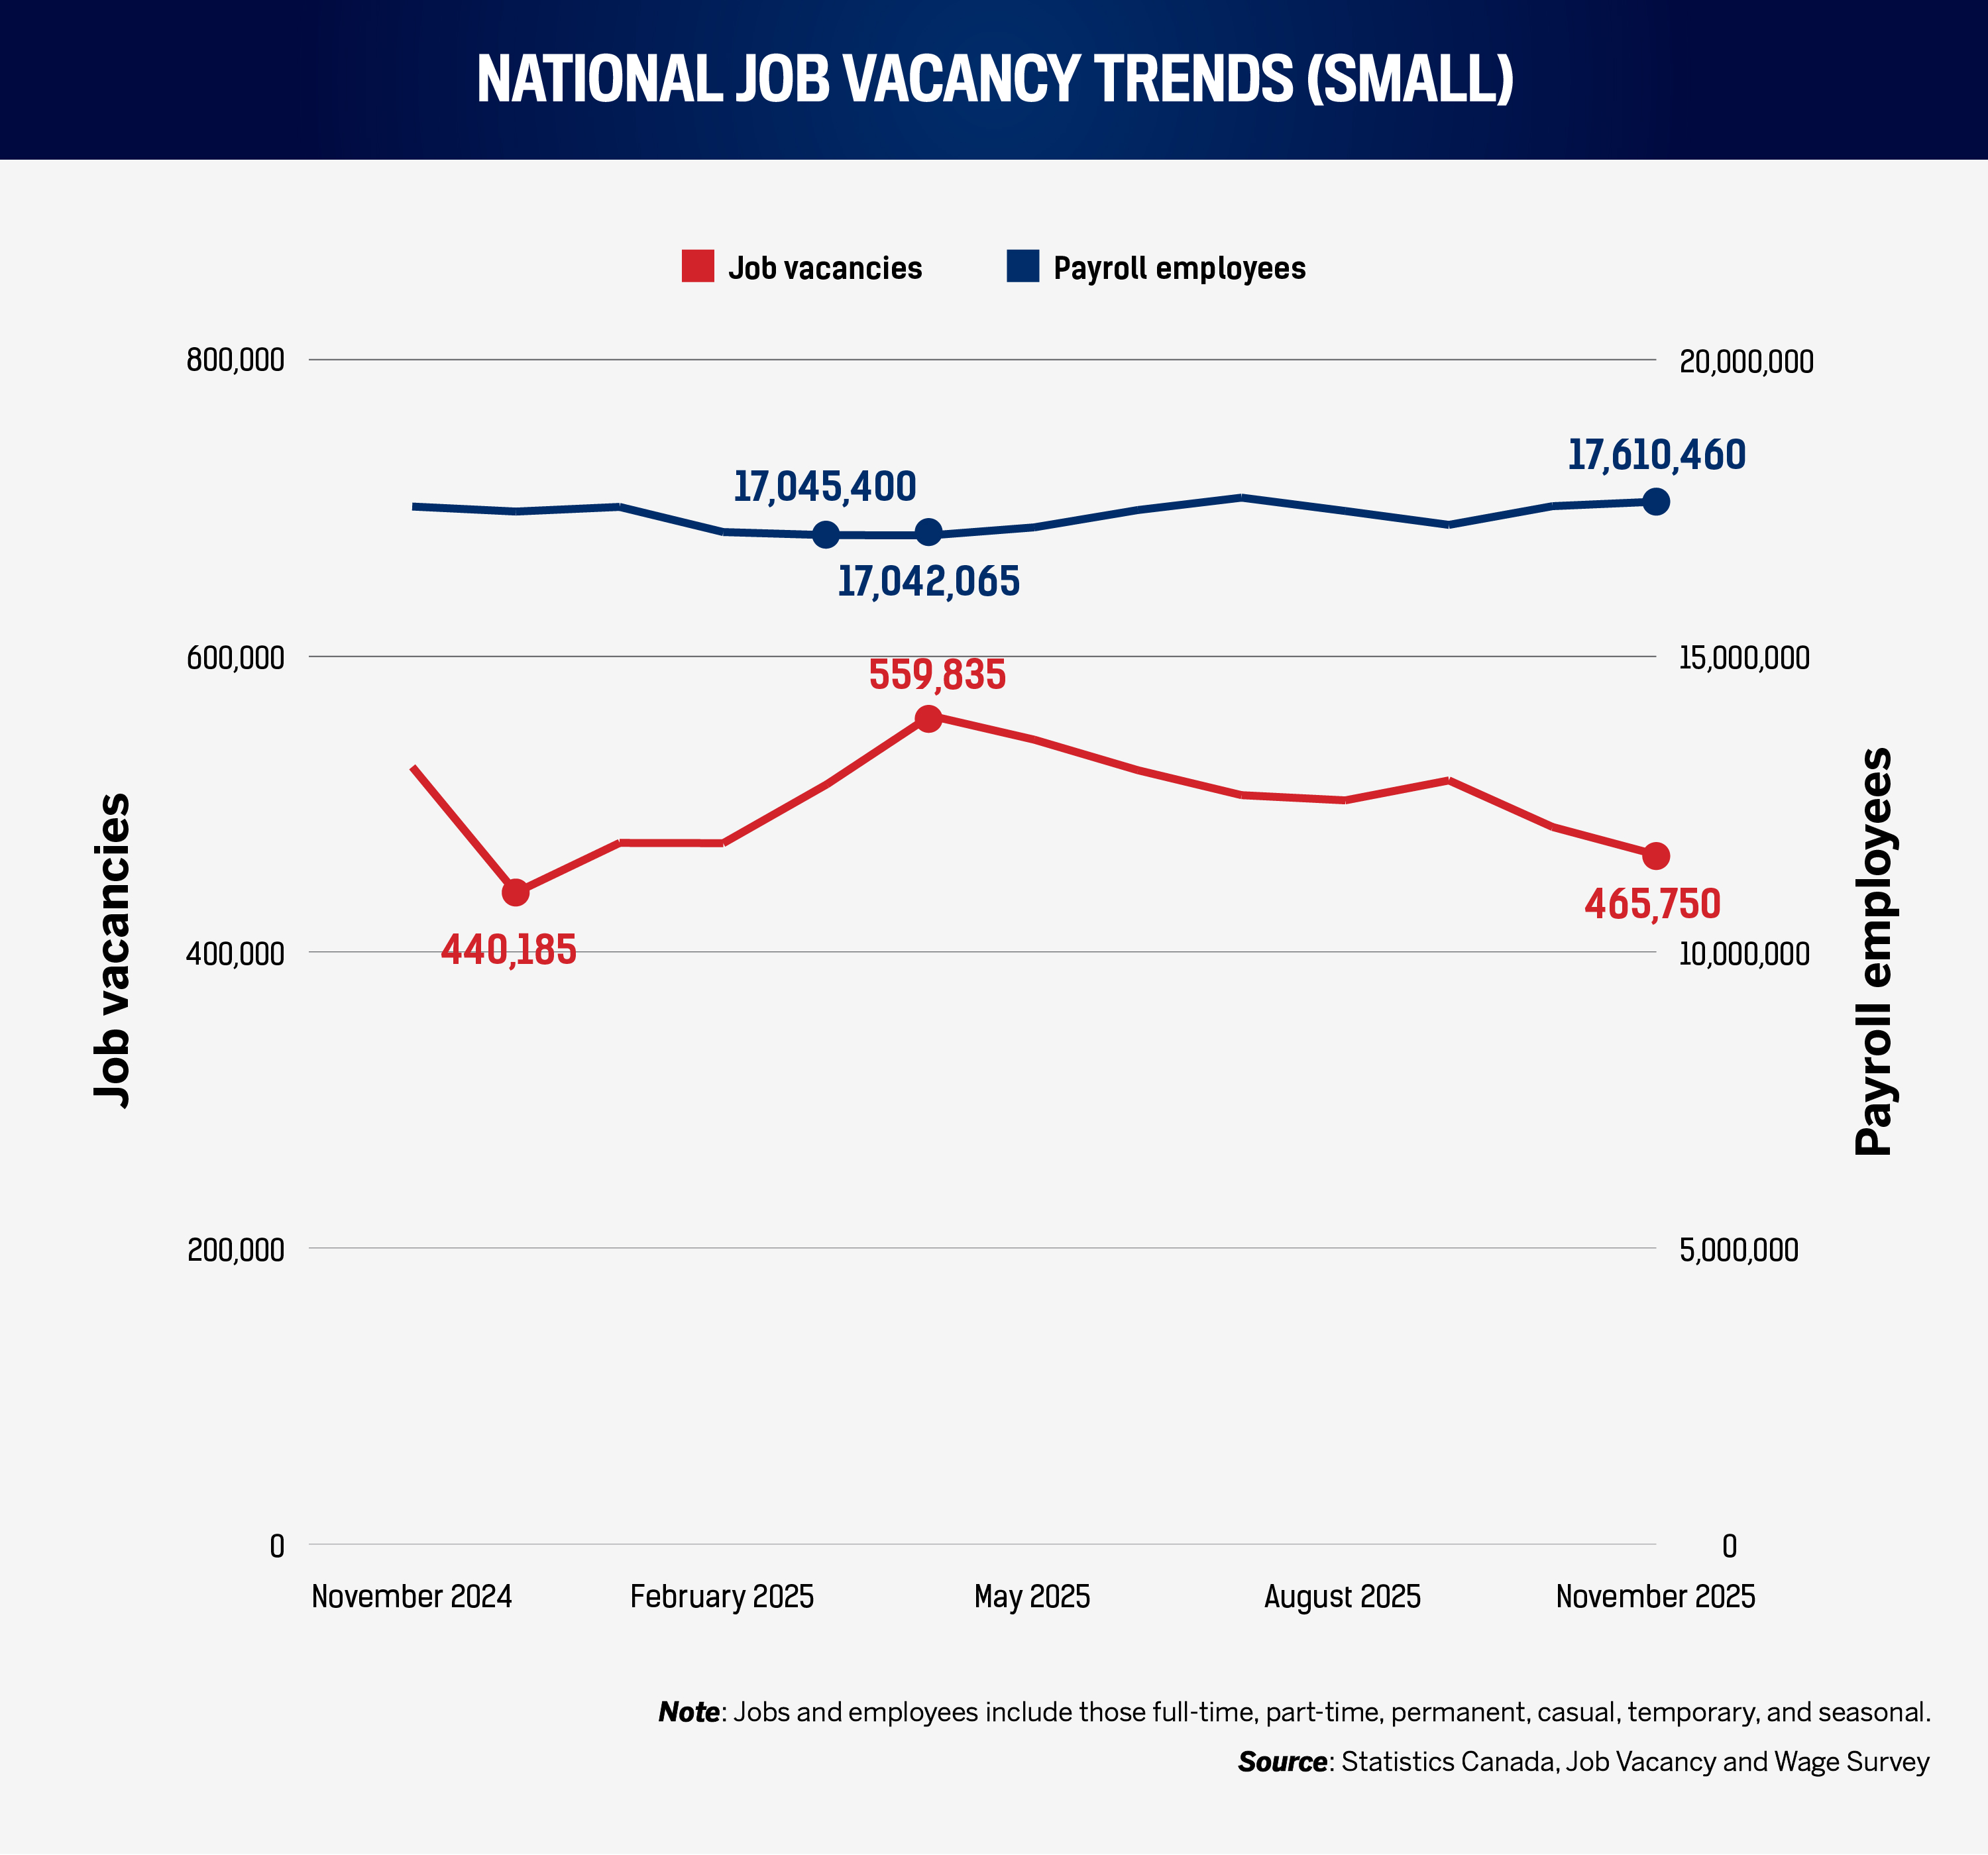
In November 2025, Canada posted 465,750 job vacancies and 17.6 million payroll employees. Those are more than 18,700 fewer available jobs than last month, and the seventh consecutive month of month-over-month availability decline, keeping the premium on jobs still largely in employers’ hands.
Nevertheless, as 17.6 million employees mean a month-on-month gain of 76,000 (last month, September-to-October posted an impressive 315,000+ employee gain). Thus, the rate of job vacancies (available jobs as a share of all taken and open jobs) cooled to 2.6 percent, the lowest in 10 months. In practical terms, this reduces the “cost of waiting” for employers. With a growing number of hires, HR can reassert structured assessment, clearer minimum requirements, and better documentation. This directly supports later risk points in this report: falling tenure and rising tribunal activity (Section 3) are both amplified by informal decision-making.
HR implication: With fewer open roles competing for the same candidates, the advantage goes to firms that standardize selection and pay decisions rather than those relying on speed and counteroffers.
1.B. Industry-specific vacancies
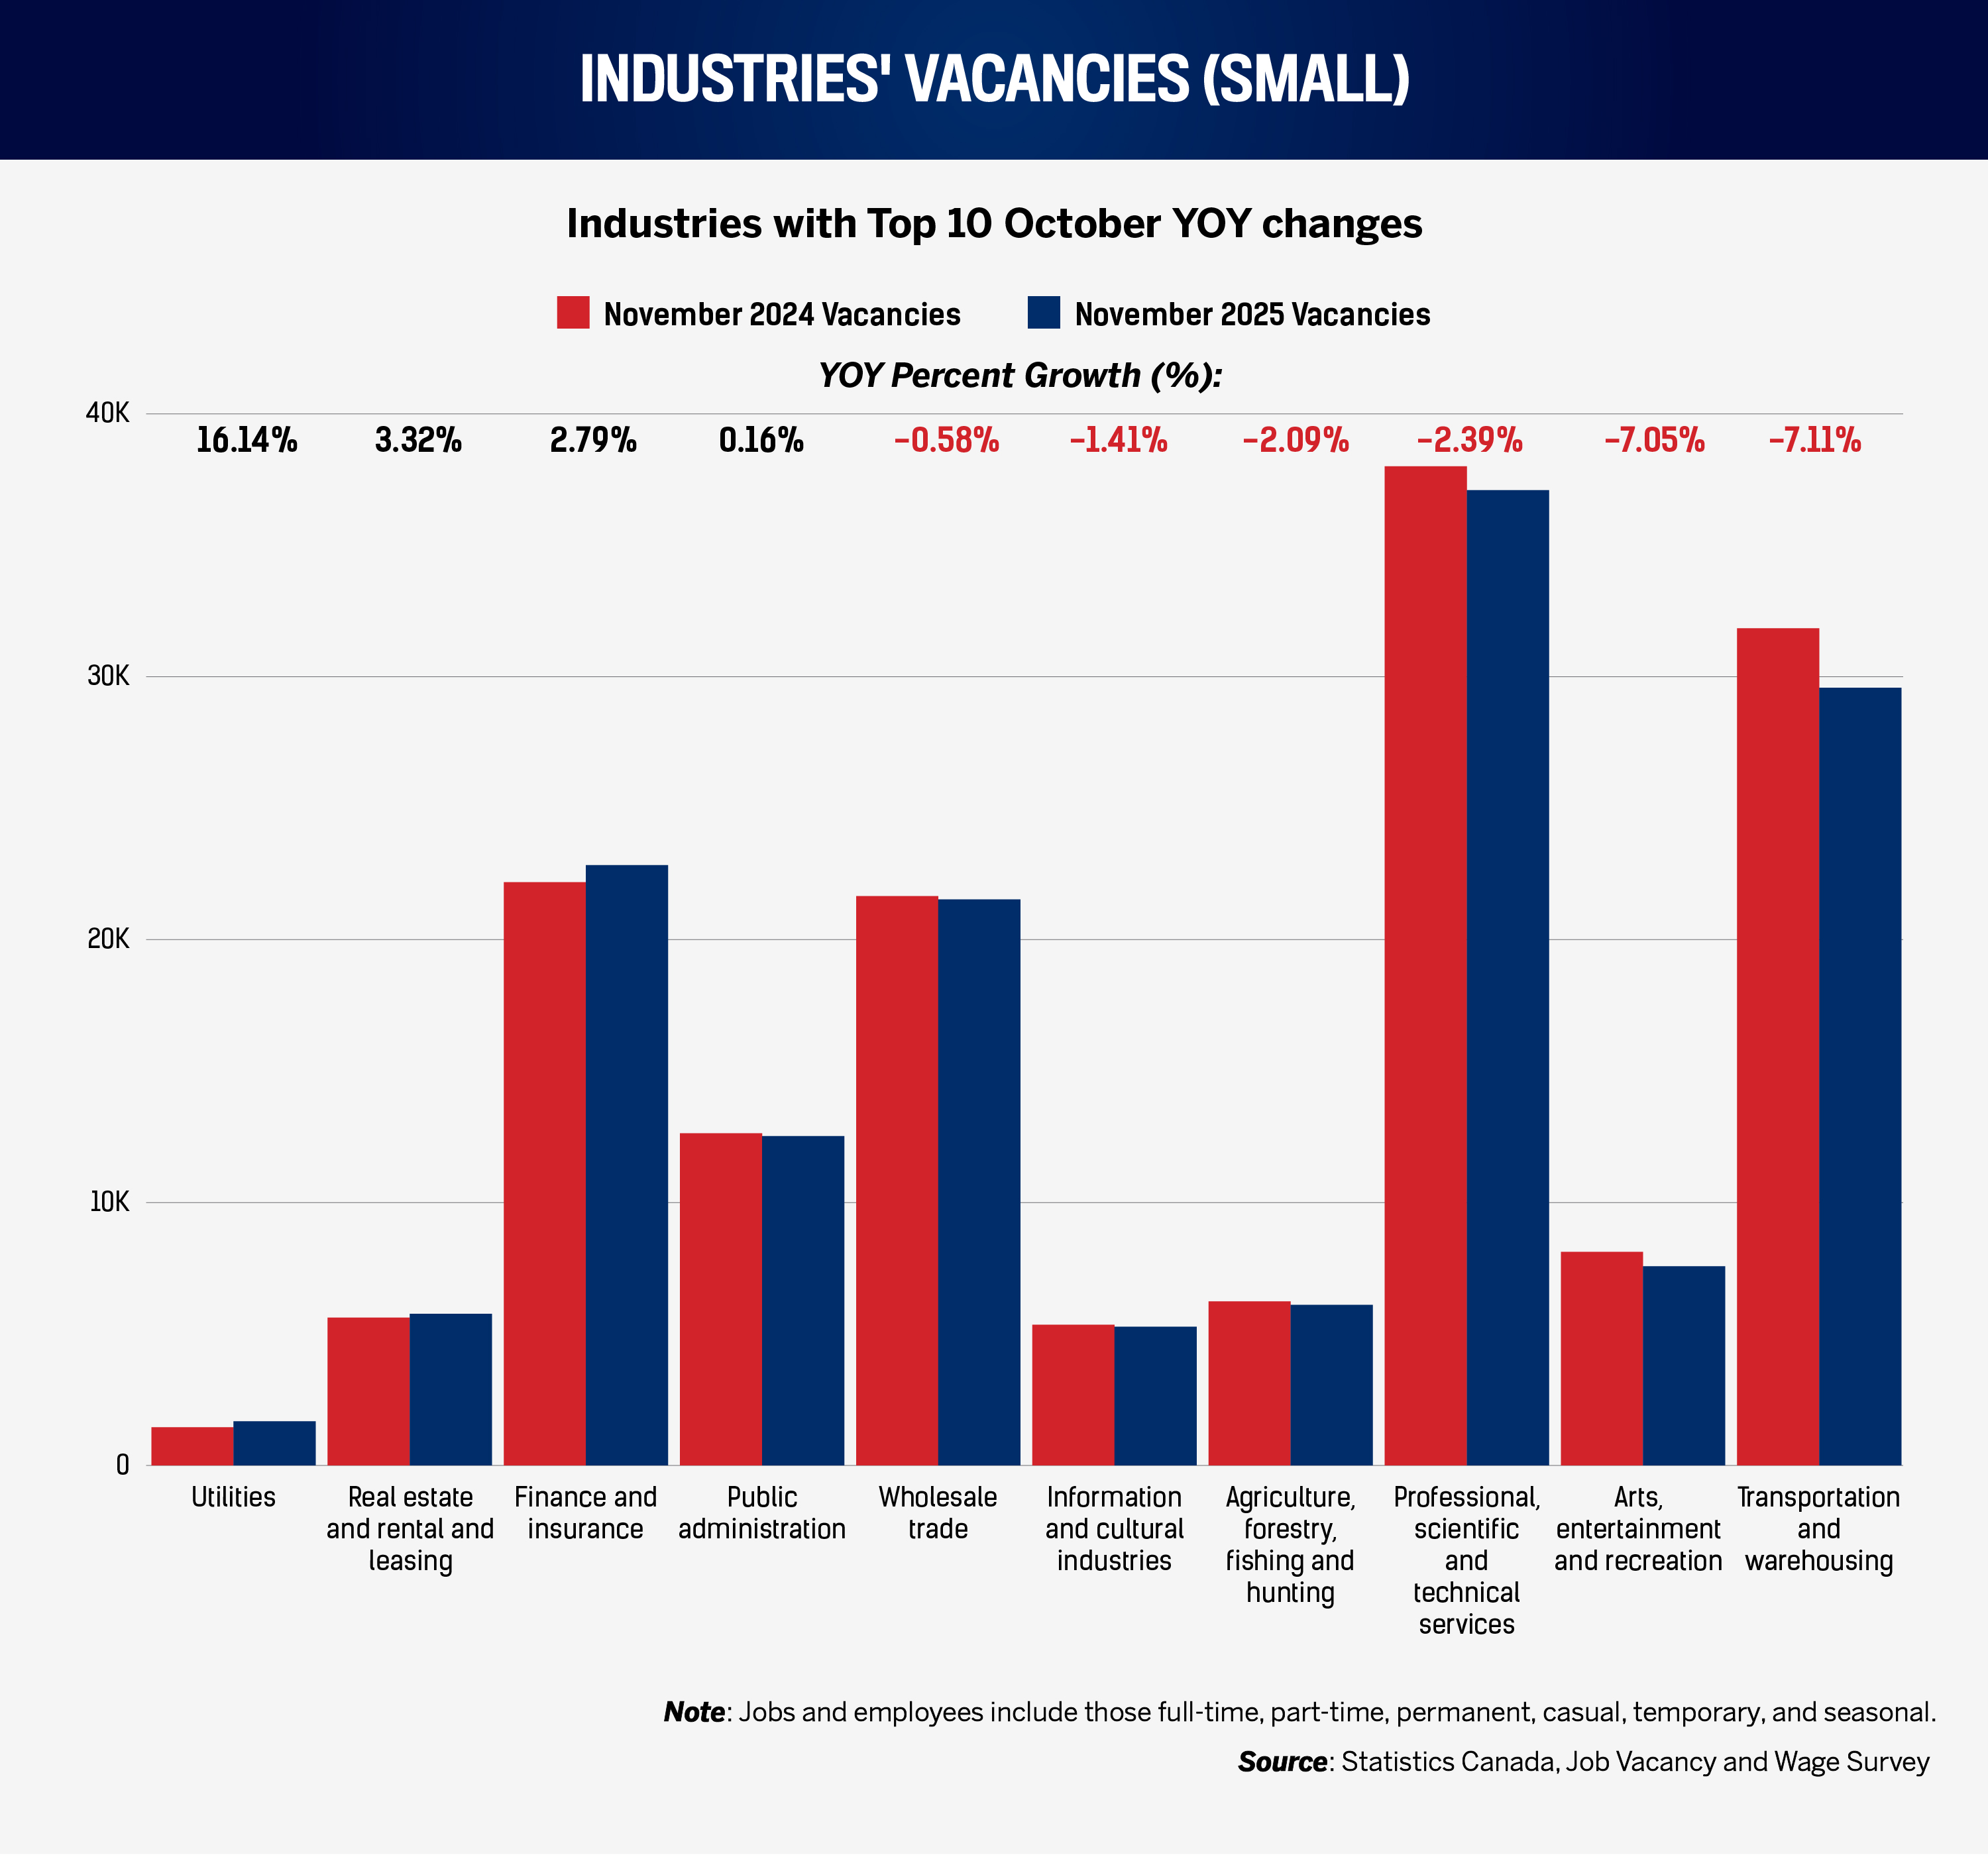
As described above, month-on-month, job availability declined in nearly every industry. Nevertheless, four industries saw marginal, or considerable, job growth compared to last year.
In November 2025, the strongest year-on-year vacancy momentum sat in utilities, with vacancies rising from 1,425 to 1,655 (+16.1 percent). Utilities is not a volume-hiring sector, but it is a bellwether for skilled, credentialled labour. When utilities vacancies expand in a cooling market, HR in adjacent sectors should assume continued scarcity for electricians, safety specialists, and certain engineering roles – and price and progression pathways, accordingly.
Two other sectors posted modest year-on-year growth in November: real estate and rental and leasing (+3.3 percent; 5,565 to 5,750) and finance and insurance (+2.8 percent; 22,190 to 22,810). These are warnings that candidate volume may improve (see above), but candidate quality and job readiness may not. In finance-related roles, tighter hiring often shifts selection toward credentials, risk management discipline, and demonstrable judgement – traits that take longer to assess.
On the downside, industries that saw November’s greatest year-on-year contractions included management of companies and enterprises (-41 percent; 1,550 total vacancies in November) and construction (-21.12 percent; 30,885 total). For HR, the operational question is not simply whether to hire, but where to improve processes. If a sector’s vacancies are falling because approvals are tightening, HR must ensure the remaining approved roles have sharper job design and clearer screening. Otherwise, time to fill may not improve despite the cooler market.
These vacancy movements also need to be read alongside tenure (Section 3). The market with fewer vacancies still yields high turnover. Where vacancies are rising while pay pressure also rises (Section 2.B), expect sharper competition for regulated, scarce, and compliance-heavy roles even in a cooler market.
2. Wages
2.A. Wages vs. inflation
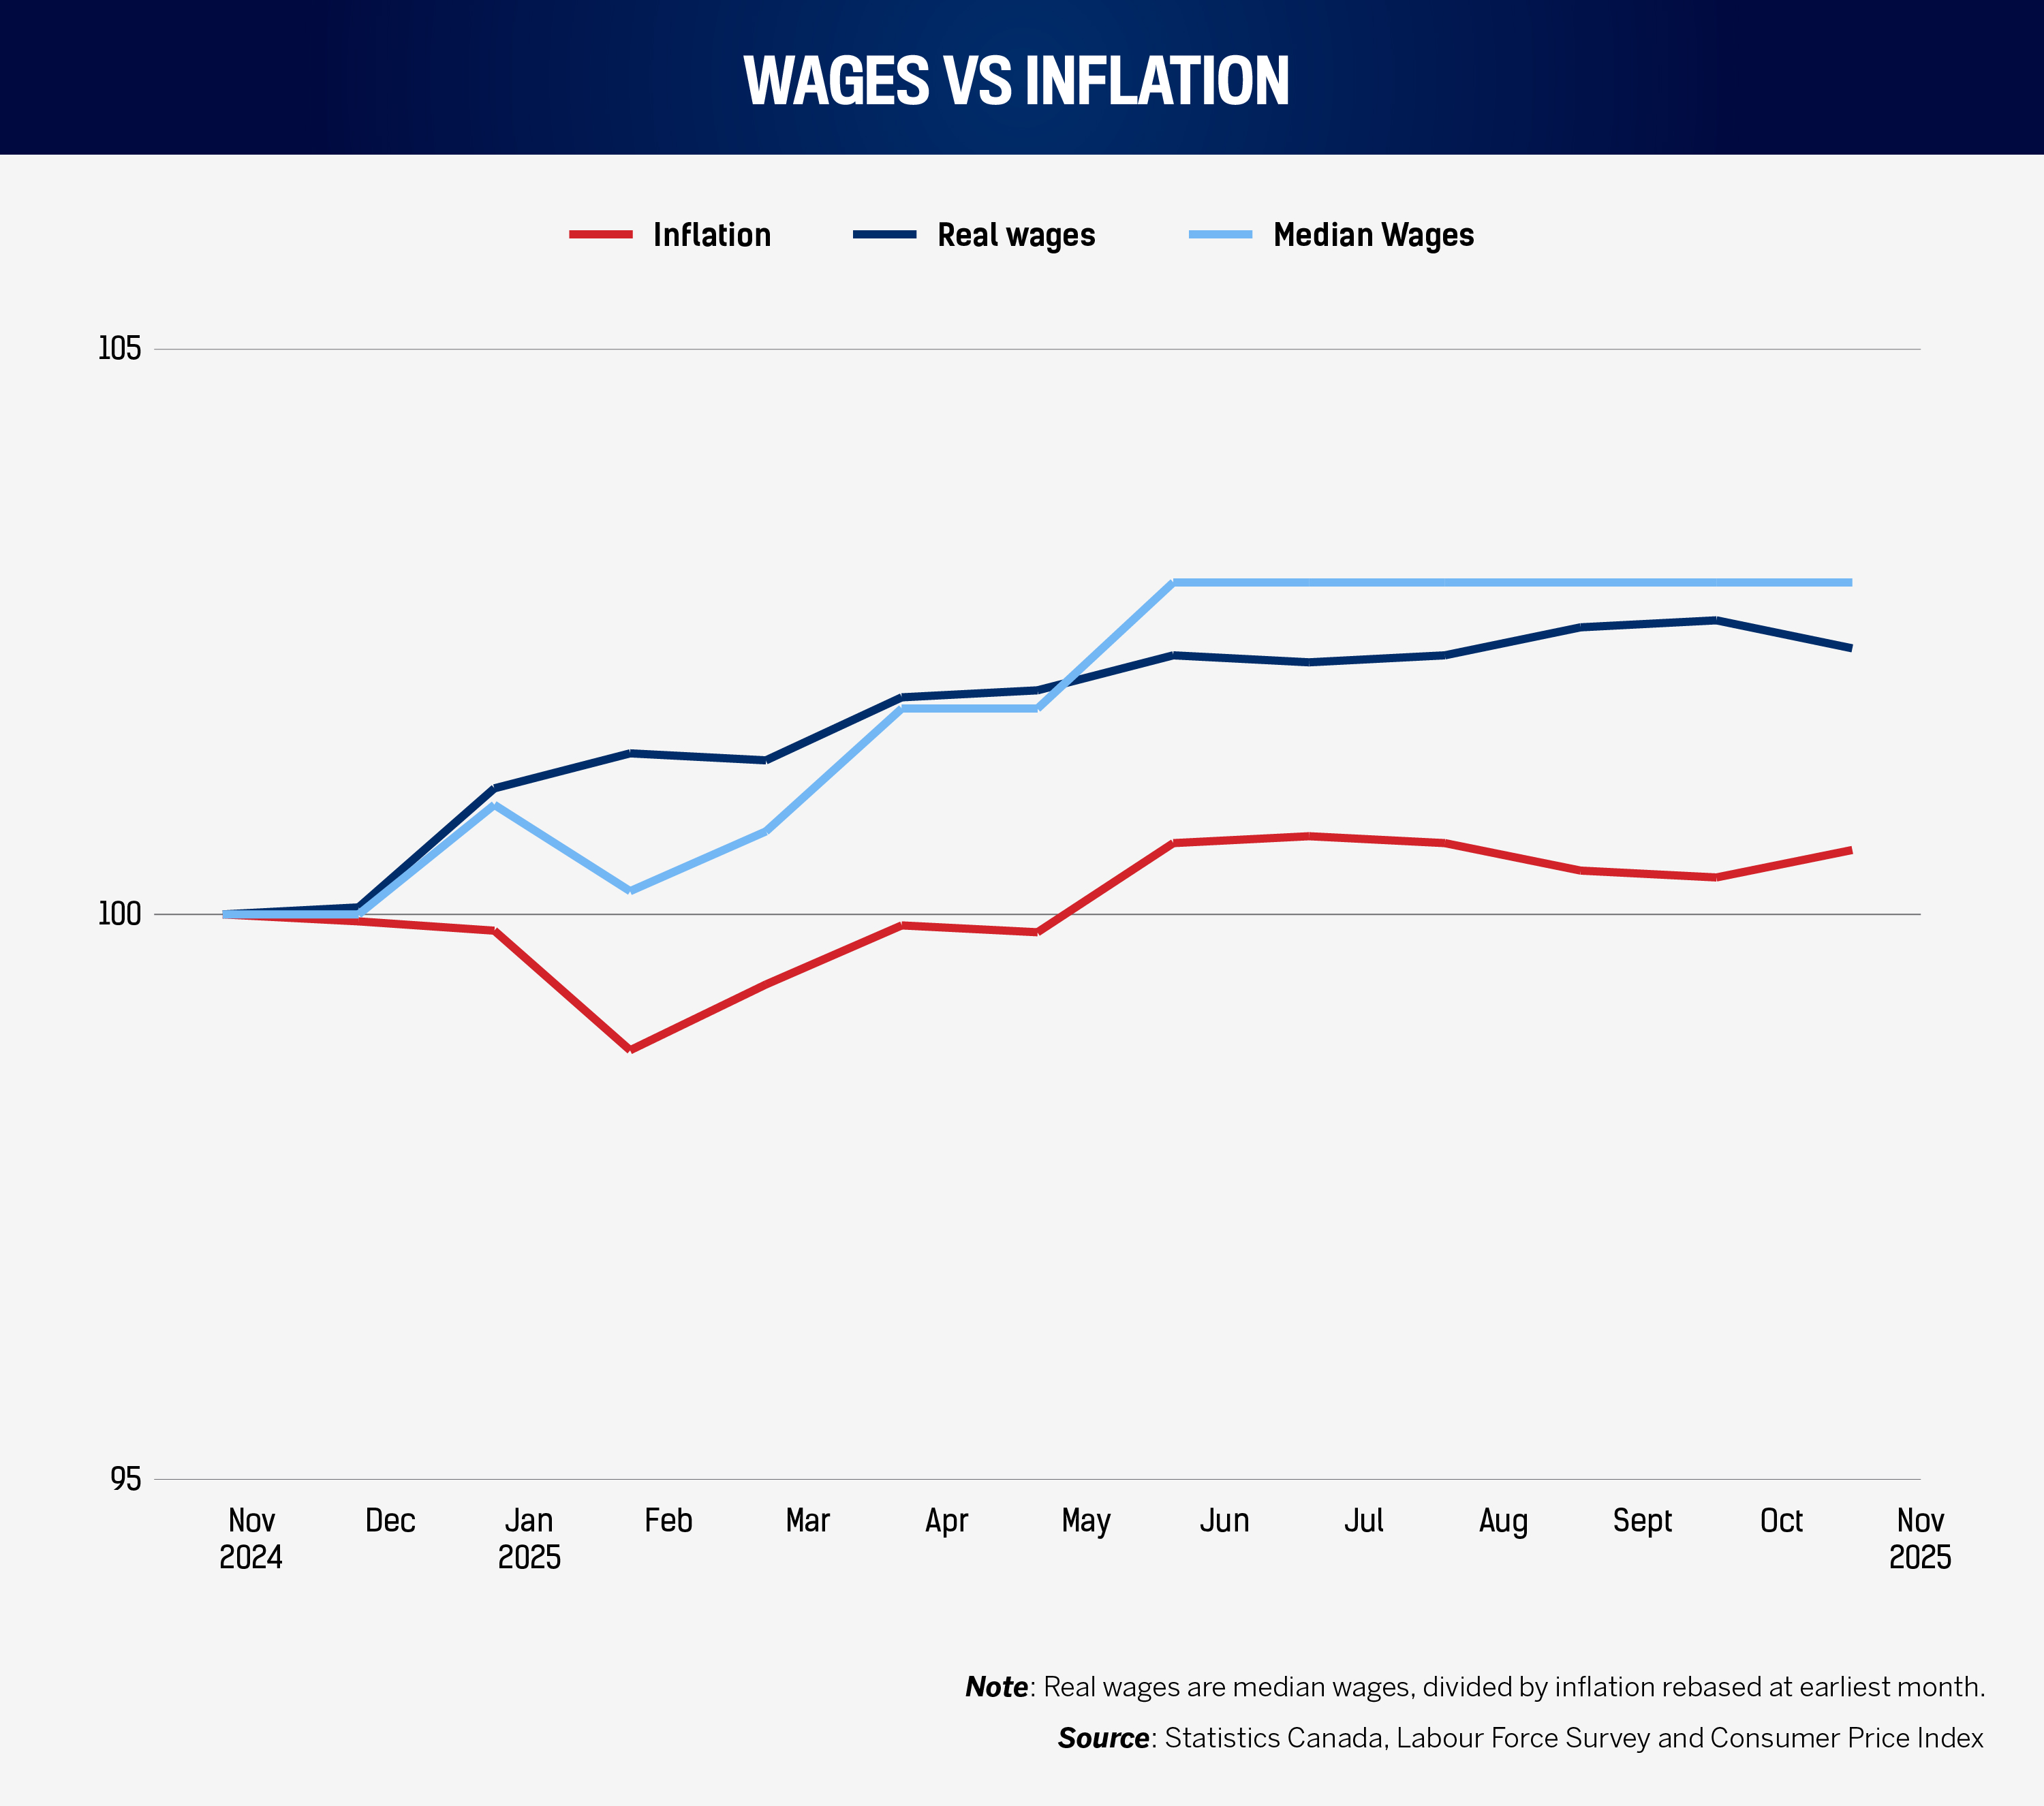
In December 2025, the median hourly wage was $35, up $1 from $34 in December 2024 and consistent over five months since July 2025.
In terms of purchasing power, CPI moved from 161.2 to 165 from December 2024 to 2025. The implied real wage rose from $34 to $34.19, a modest increase supported by relatively cool month-to-month Canadian inflation.
In a cooling market with easing inflation, many organizations can hold real pay steady with smaller nominal movements. That creates breathing room to redesign pay architecture: narrower exception handling, better-defined pay bands, and clearer progression criteria.
Additionally, HR shouldn't interpret a flat median wages since July as “no pay pressure.” A flat median wage can engender sharp targeted premiums, particularly where vacancy signals or compliance requirements are concentrating demand (see above). Identify roles where market pressure persists (Sections 1.B and 2.B), and be explicit about when and why wage exceptions are allowed.
2.B. Industry-specific median wage change
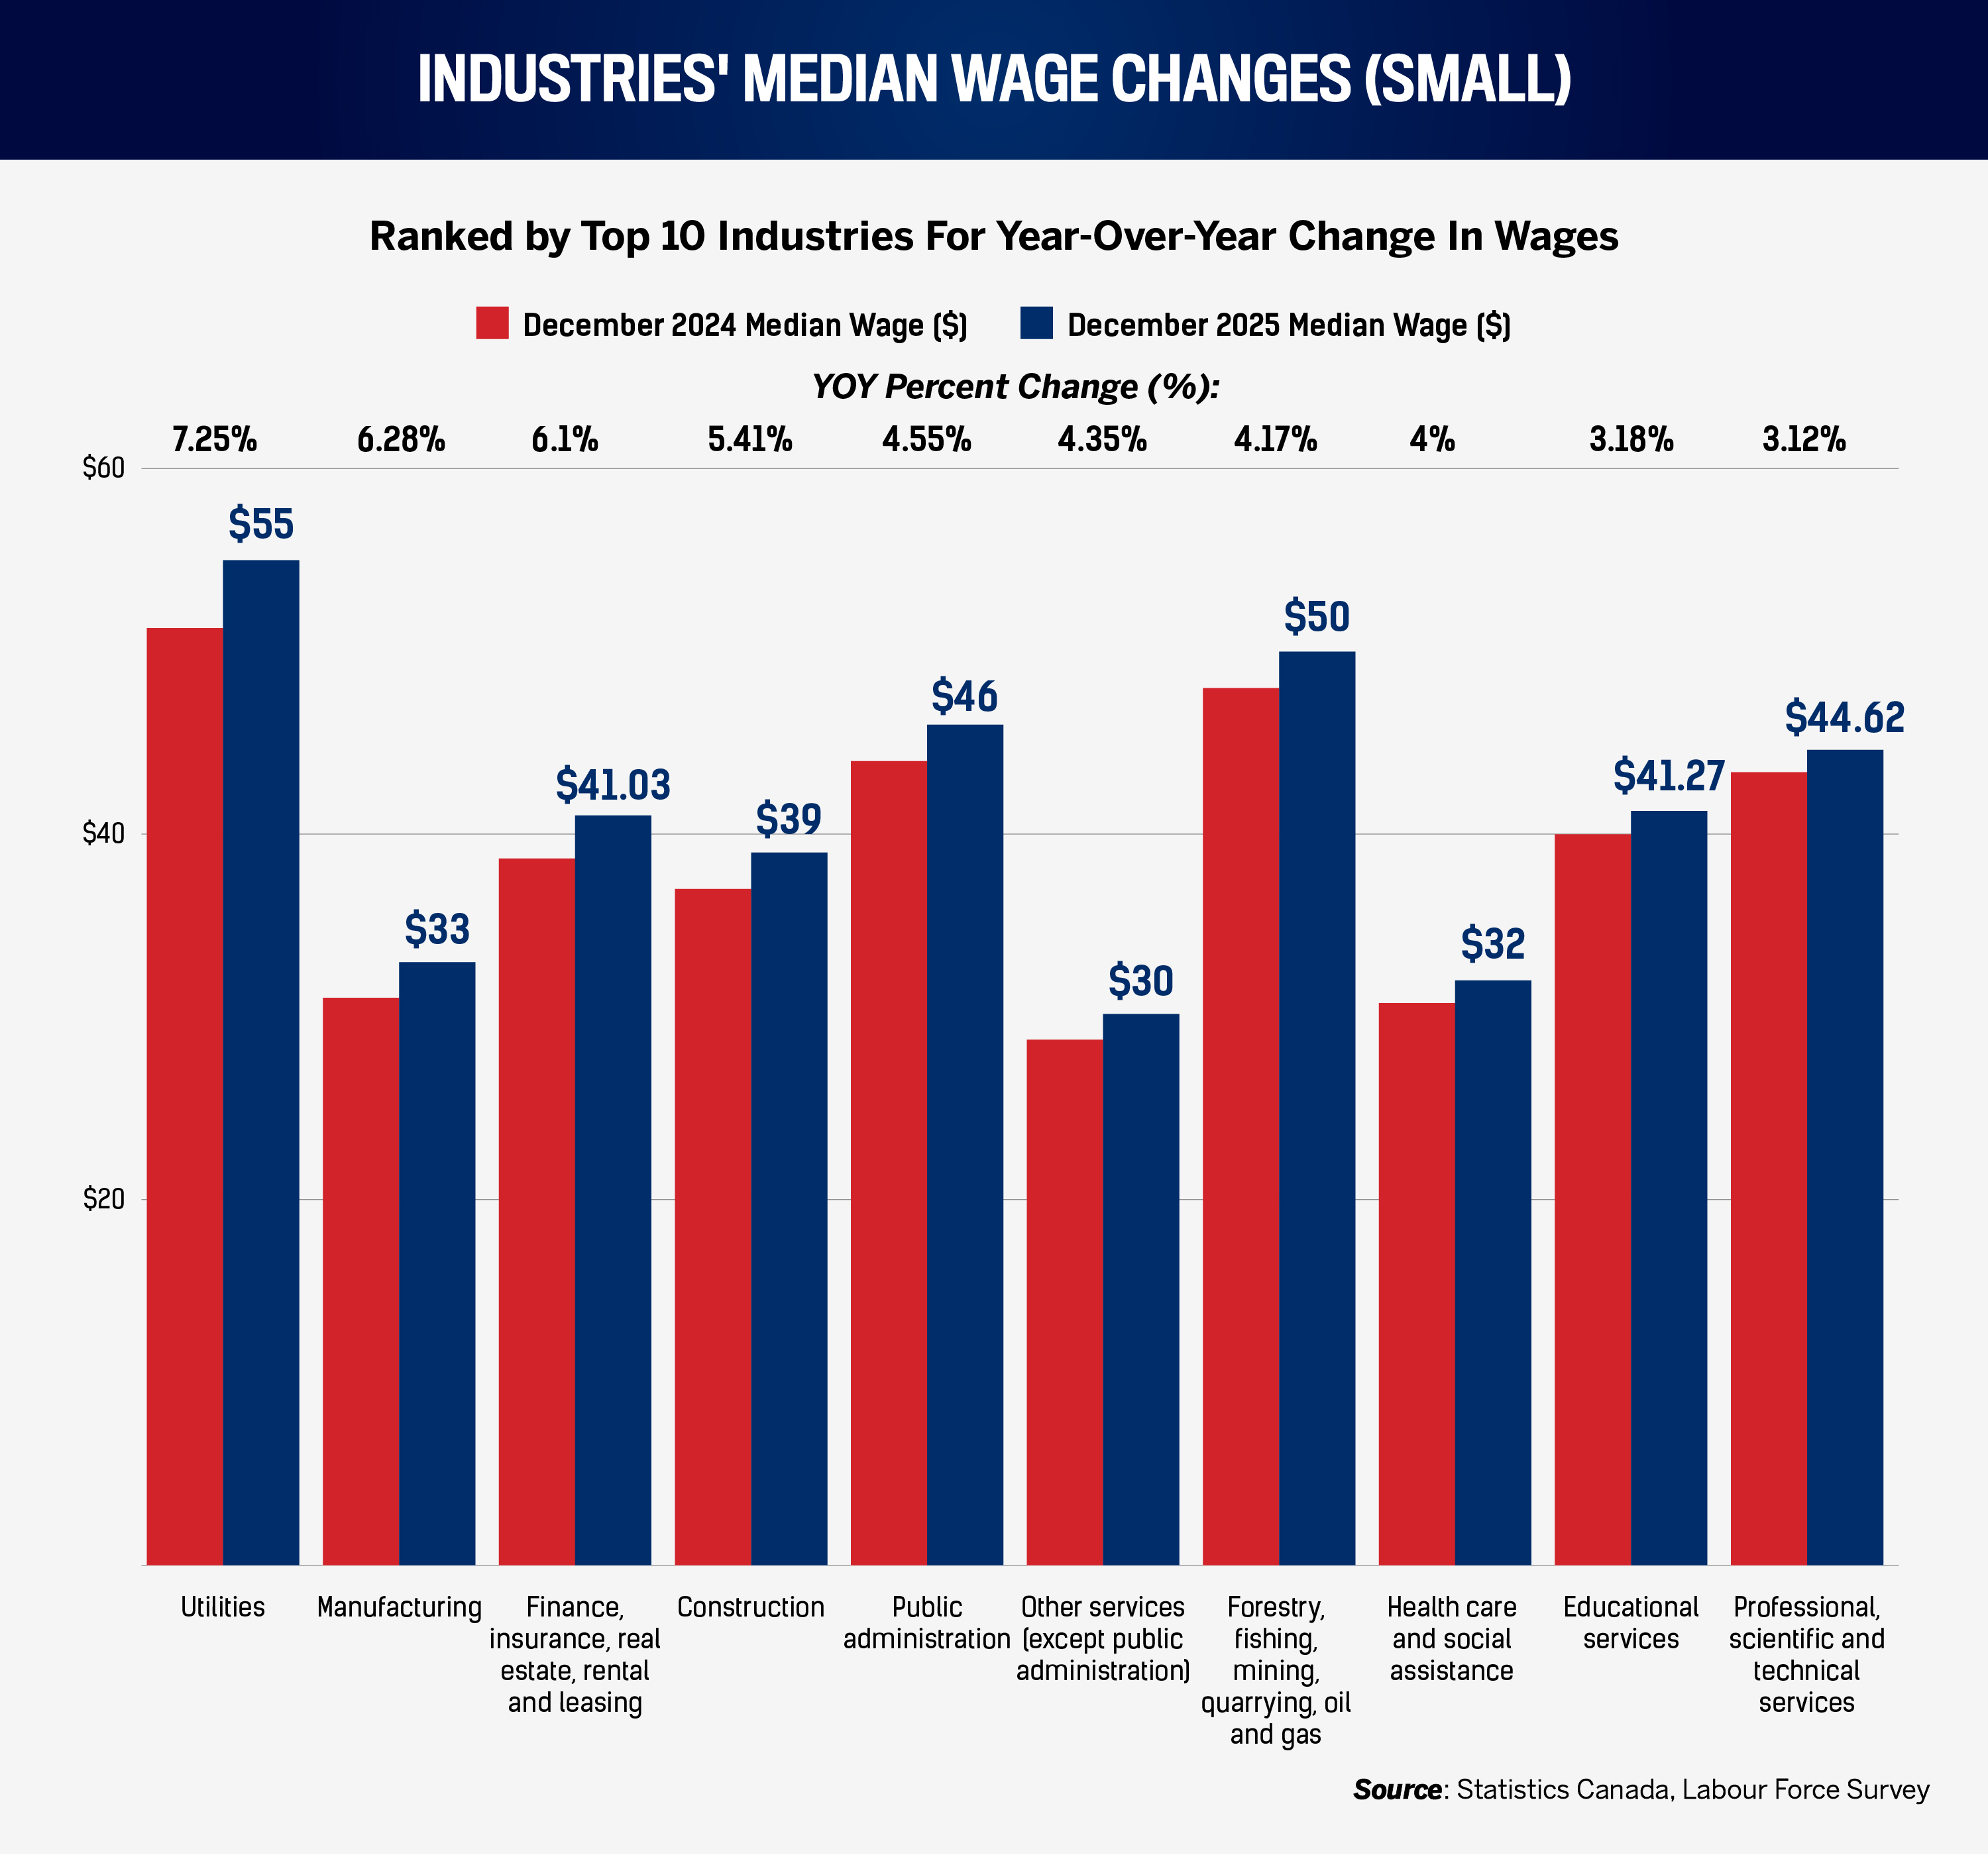
Utilities lead again for this month’s year-over-year wage improvement, suggesting a premium for the industry’s long-term job growth. Utilities’ 7.3 percent wage increase to $55 an hour is likewise a reference point for competing employers. Where organizations share talent pools with utilities (particularly for safety-critical maintenance and engineering), HR needs an explicit response: either match pay for true substitutes, or redesign roles so that you are not competing for the same labour.
Manufacturing’s year-over-year wage increase to $33 (+6.3 percent) and month-over-month increase of $3 deserves careful handling. The industry saw year-over-year job vacancies decline eight percent and month-on-month jobs decline by over 3,700, as higher wages expected by manufacturing professionals may be reducing the demand for these professionals. HR’s best defence is job architecture: distinguish truly scarce roles from broadly trainable ones, then align pay progression and training investment.
Finance-related roles rose wages to $41.03 (+6.1 percent year-over-year), along with available jobs year over yar. HR should treat finance wages and broadening roles as a proxy for compliance and risk burdens: where regulatory scrutiny rises, the labour market prices in judgment, documentation, and error-cost avoidance.
Educational services appear in the top group at +3.2 percent to $41.27, while health care and social assistance rose +4 percent to $32.
Even if your organization does not operate in these sectors, they closely correlate with stability and fairness in local labour markets. The HR response is rarely to mimic public-adjacent pay. It is to compete through clear progression, manager capability, and credible workload design – factors that also reduce tenure erosion (Section 3).
2.C. Industry-specific gender wage gap
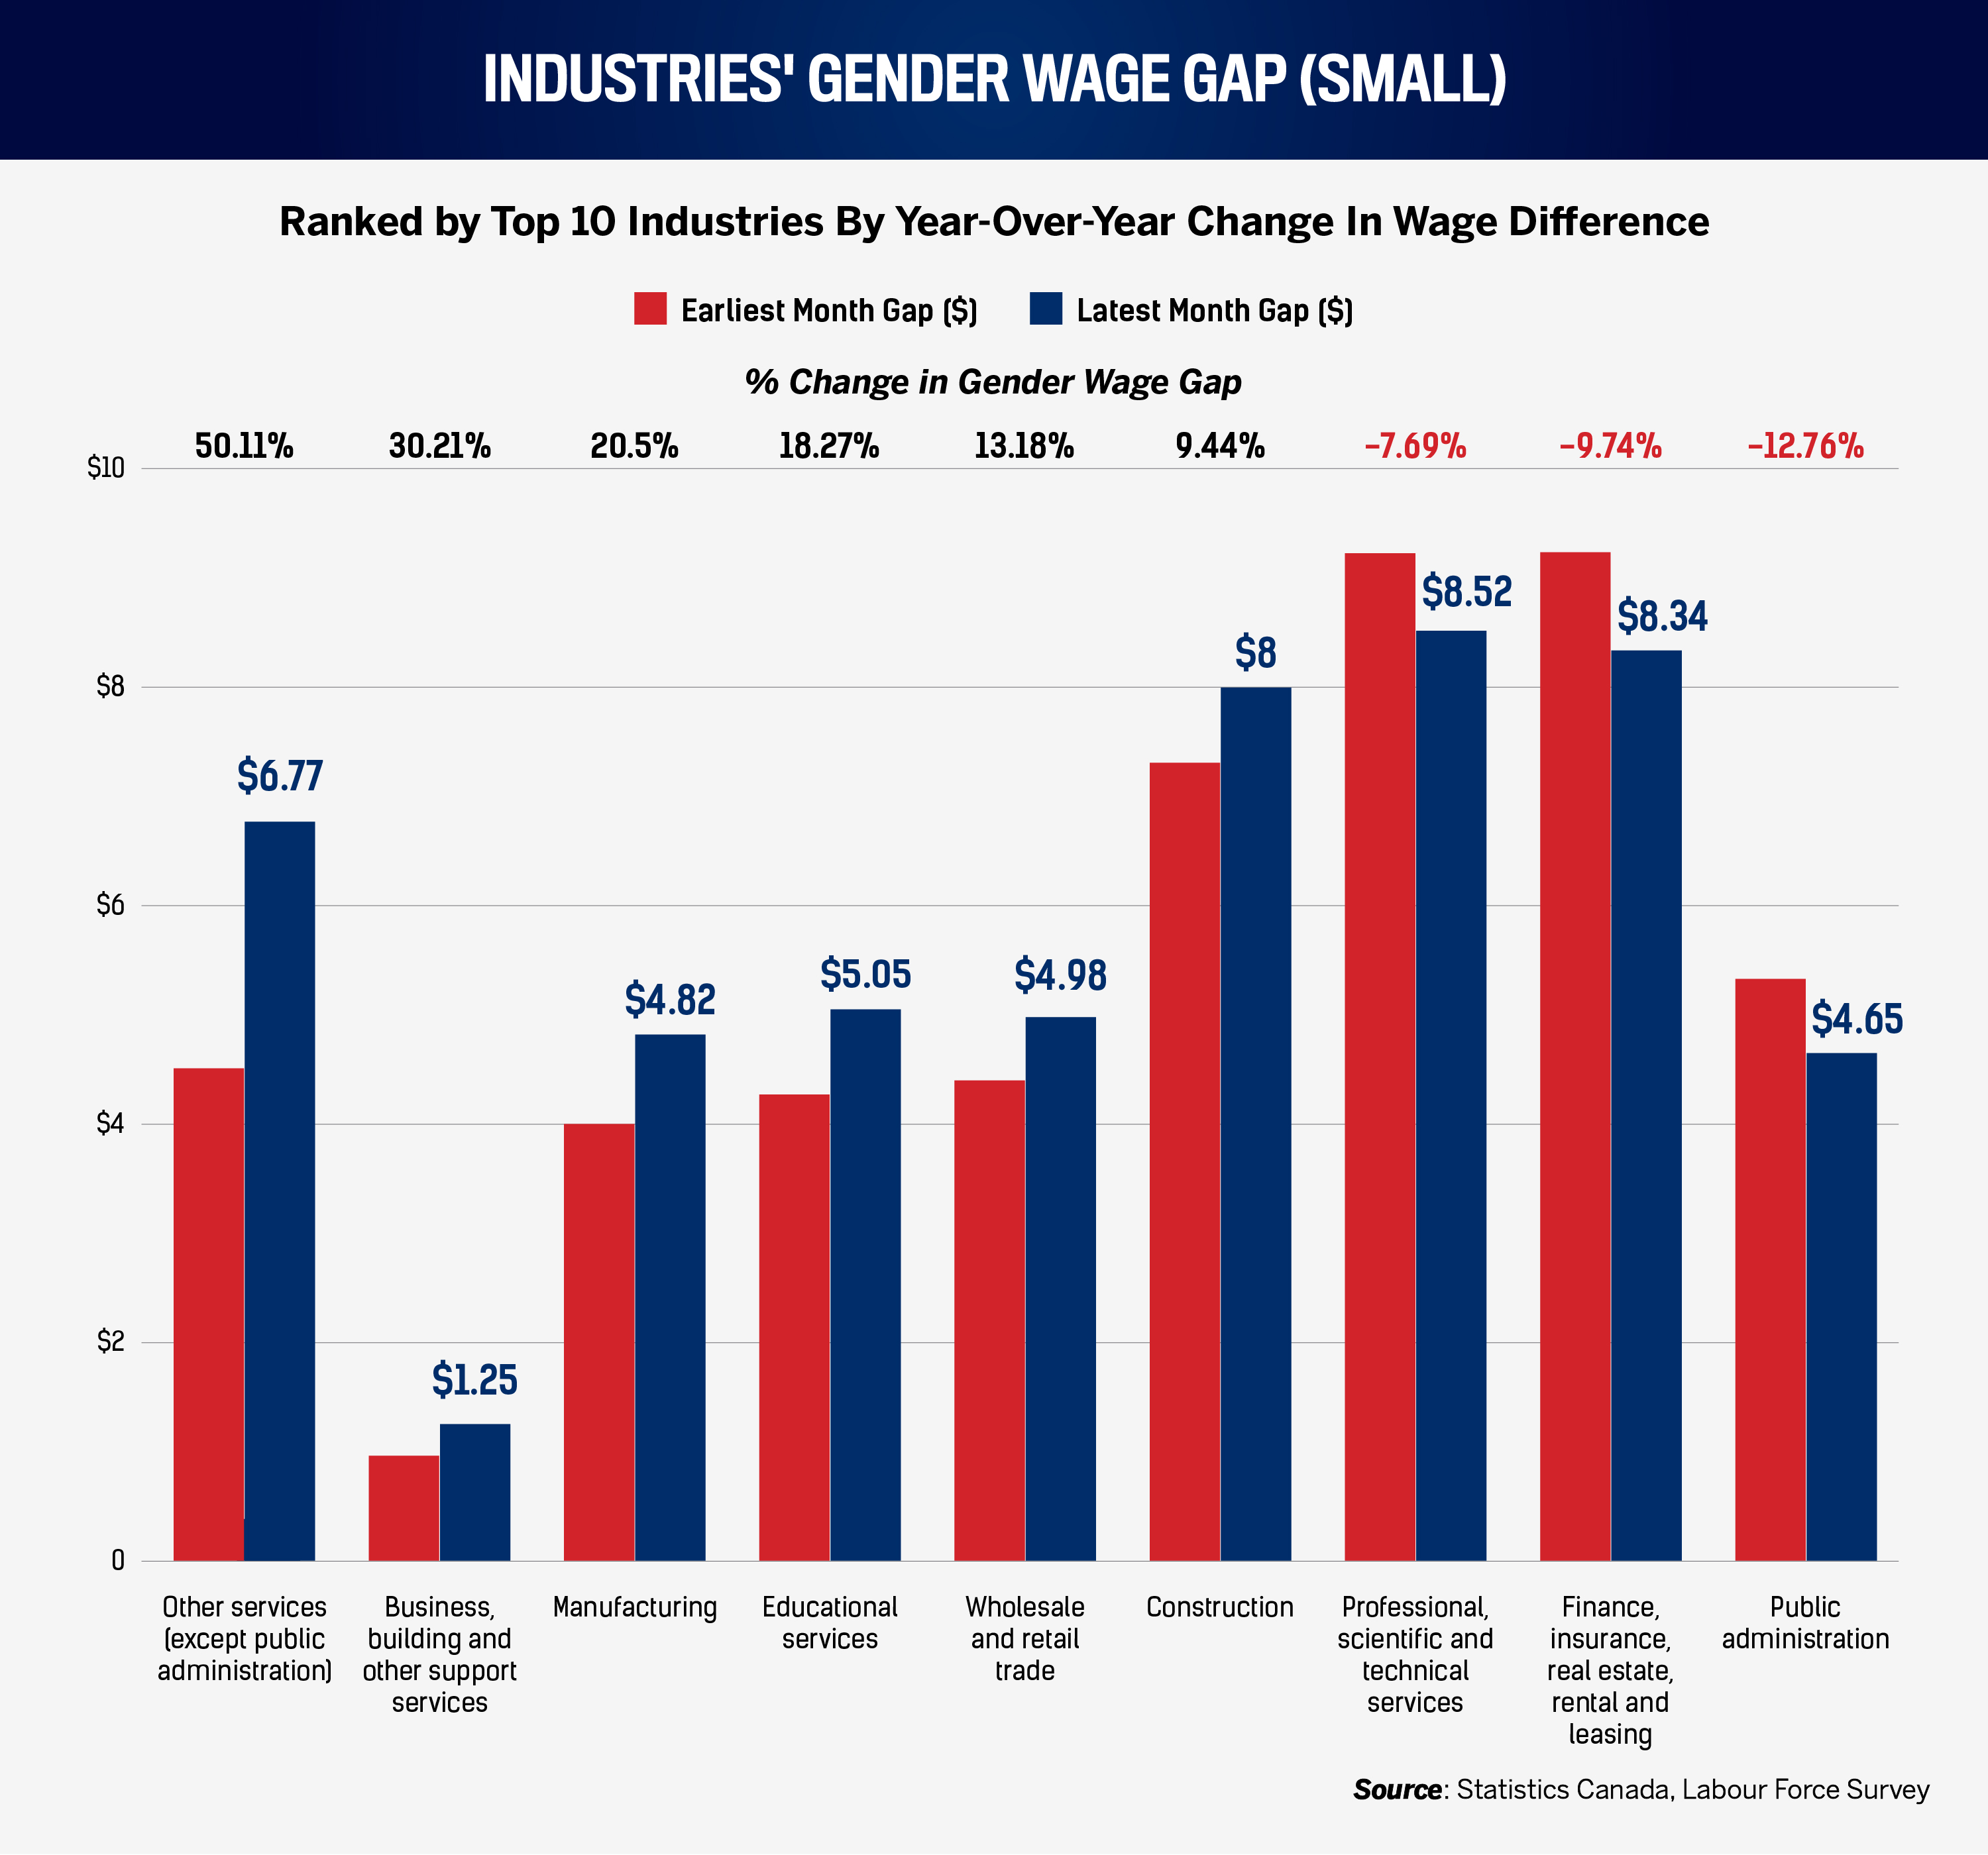
In December 2025, the largest proportional deteriorations were concentrated in sectors where pay decisions often include premiums, shift access, and assignment effects. Other services (except public administration) moved from a pay gap between men and women of 4.51 to 6.77 (+50.1 percent). Crucially, business, building, and other support services rose from 0.96 to 1.25 (+30.2 percent). These are not merely “compensation team” issues. They are operating model issues: who gets the overtime, who gets the better route, who is placed on the higher-value contract, and who is sponsored into the next role.
Manufacturing’s measured gap rose from 4 to 4.82 (+20.5 percent). Manufacturing is also a strong wage-growth sector this month. The HR risk here is predictable: higher pay plus widening gap becomes a story employees can grasp quickly and resent. The response should be operationally grounded: audit shift allocation, premium eligibility, job bidding, and supervisory discretion, then align them with transparent criteria.
Finally, note the counterexample: public administration improved (-12.8 percent) and finance-related industries improved (-9.7 percent).
3. Tenure and litigation
3.A. Average months of tenure by industry
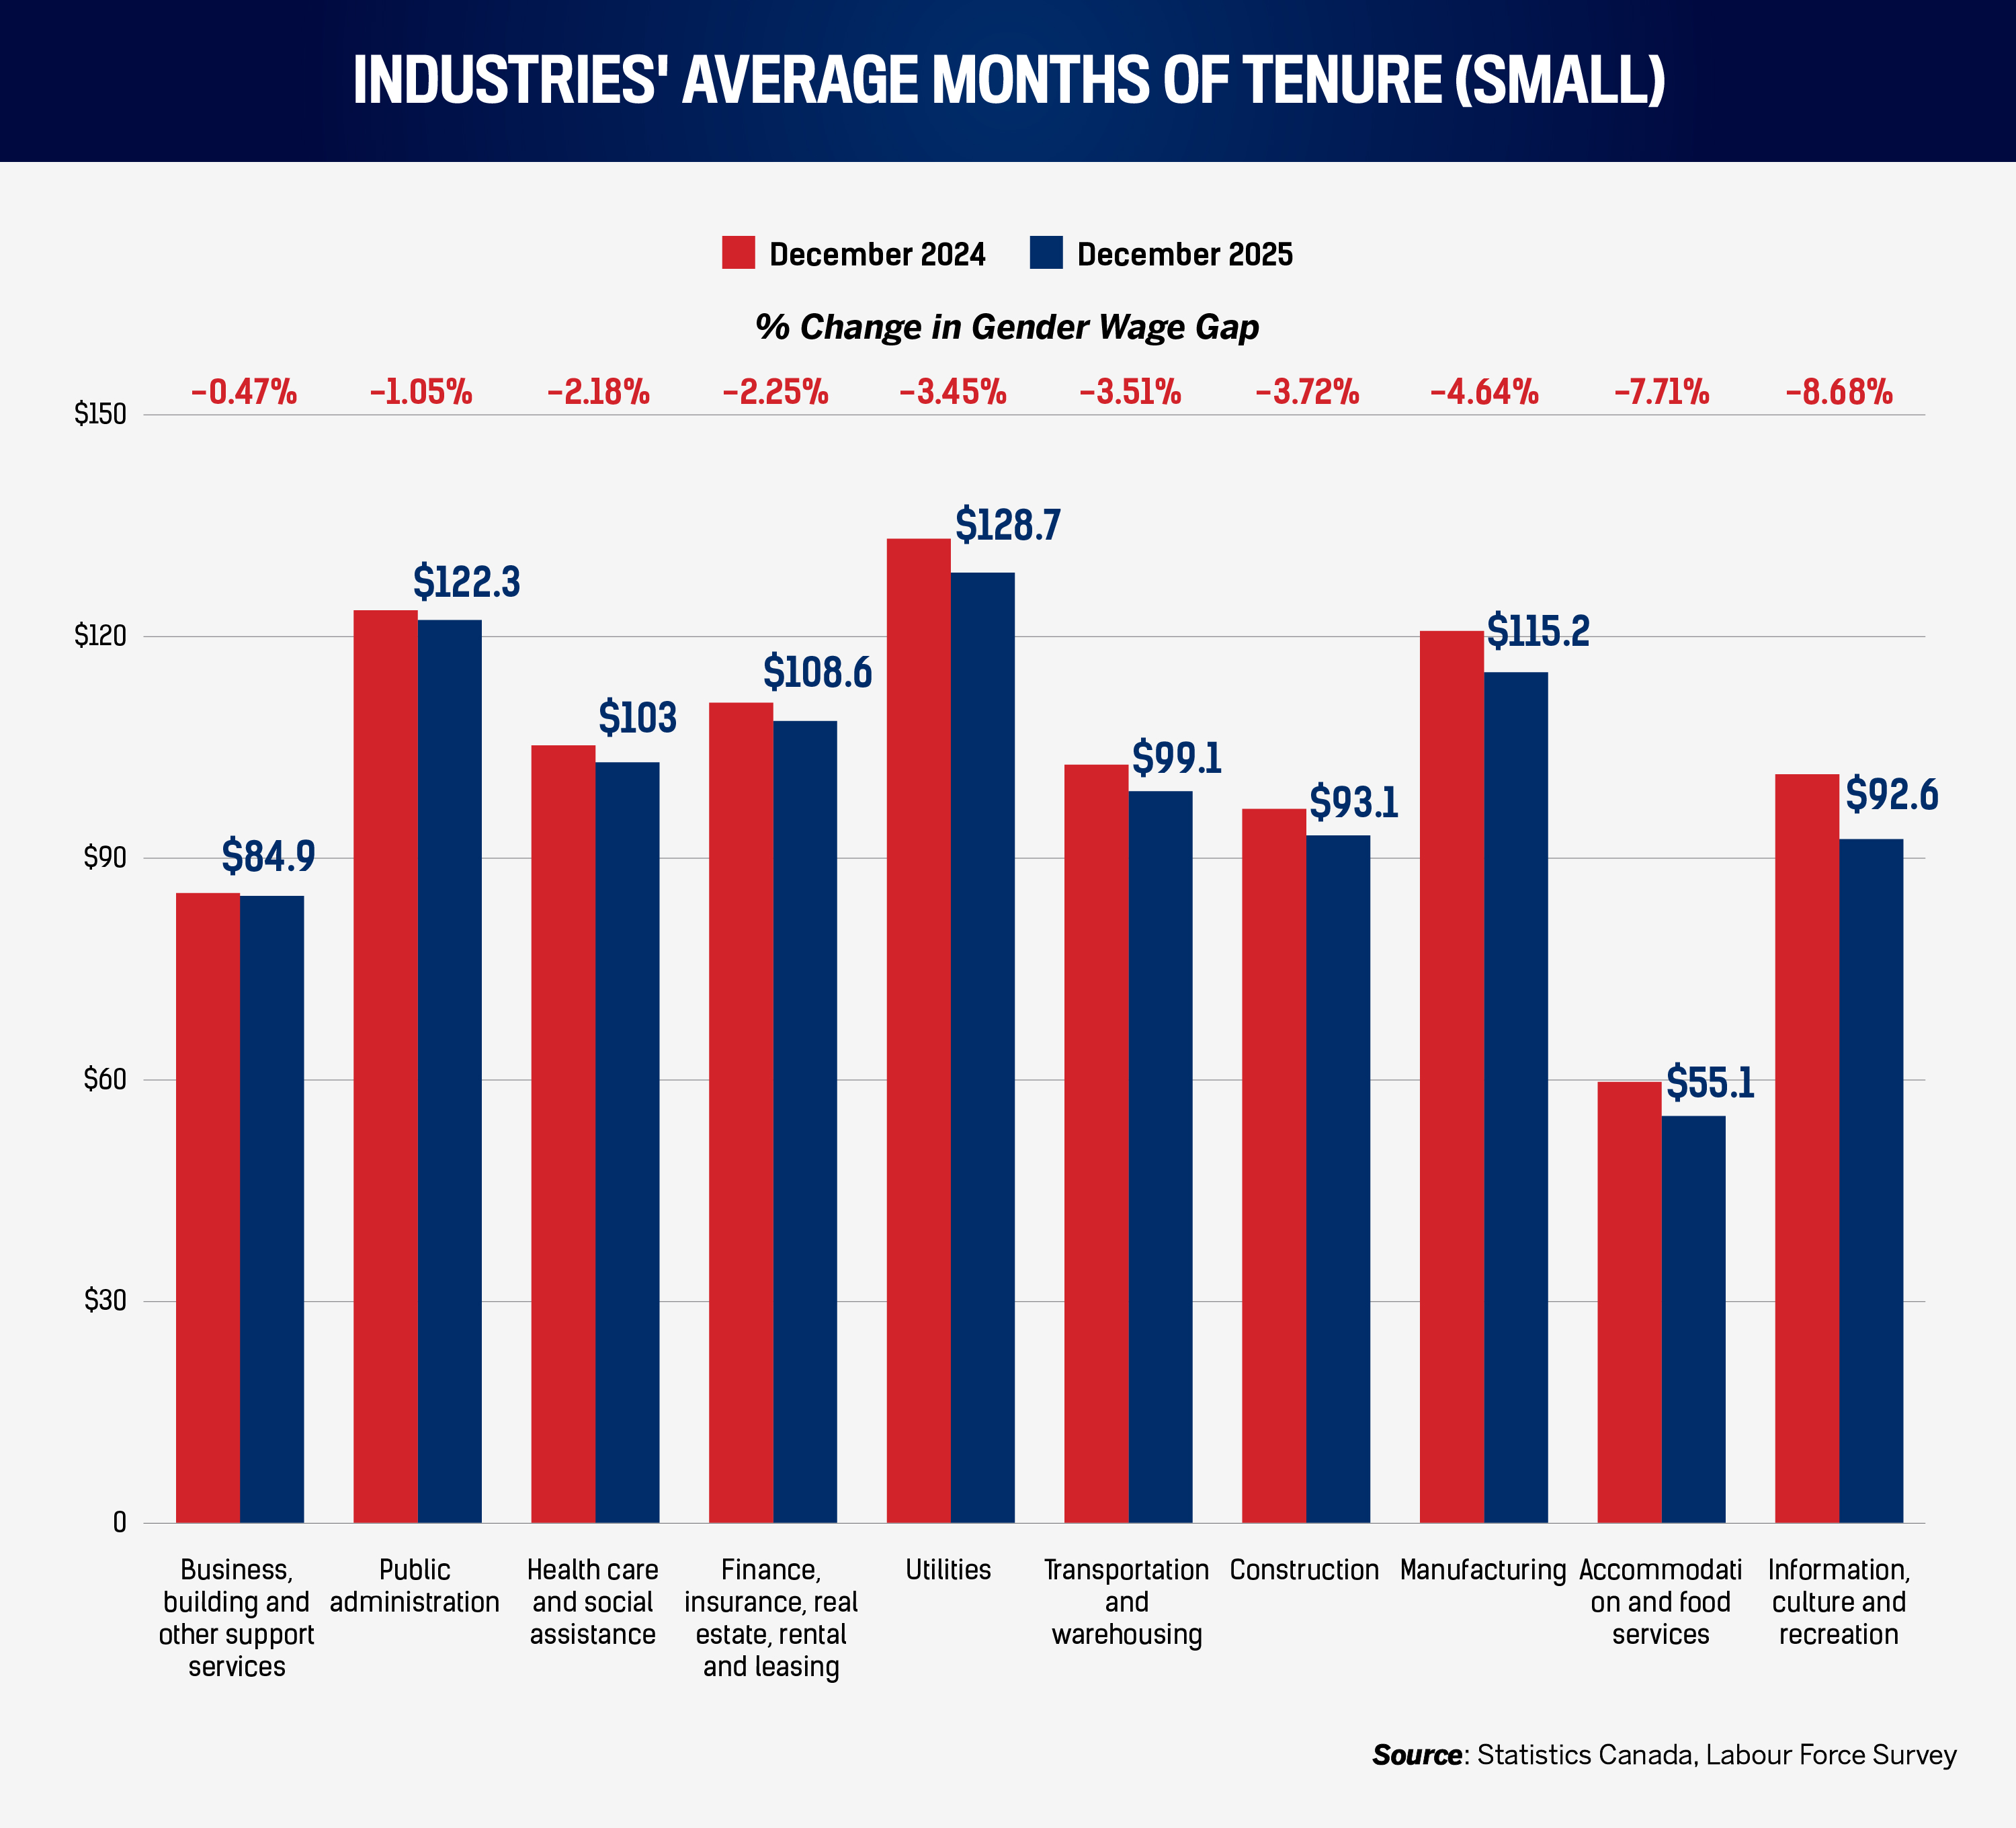
From December 2024 to December 2025, information, culture, and recreation tenure fell from 101.4 months to 92.6 months, an 8.7 percent decline. For the prominent industry, that is nearly nine months of worker tenure lost in a year. For HR, the key is diagnosis. When tenure drops in sectors that often trade on brand, flexibility, or “interesting work,” the fix is rarely a blanket raise. It is work design, predictable scheduling, credible performance management, and visible internal pathways.
Accommodation and food services tenure declined from 59.7 to 55.1 months (-7.7 percent) year-on-year. That is consistent with a sector where turnover is structurally high, but it still matters strategically: as vacancies cool (Section 1.A), leaders may be tempted to cut retention investment. Tenure data argue against that; a cooler market does not remove the daily frictions – hours, workload, manager quality – that drive evidently rising exits.
More concerning is the breadth. Manufacturing fell from 120.8 to 115.2 months (-4.6 percent), construction from 96.7 to 93.1 (-3.7 percent), and transportation and warehousing from 102.7 to 99.1 (-3.5 percent). These are sectors where churn has direct safety, quality, and productivity costs. HR should treat tenure decline as a leading indicator of operational risk: higher training load, more near misses, weaker documentation, and higher grievance probability.
Utilities and finance-related industries also declined, despite leading wage growth (Section 2.B). This is the sharpest managerial lesson in the pack: paying more can coincide with staying less. When that happens, HR should look first at supervisory depth, workload stability, and progression credibility. These are also the precise factors that, when neglected, show up later as procedural disputes (Section 4).
3.B. Tribunal cases
Canadian employment-related tribunal cases totaled 925 in the final month of 2025, down 127 from one year earlier and 73 from November.
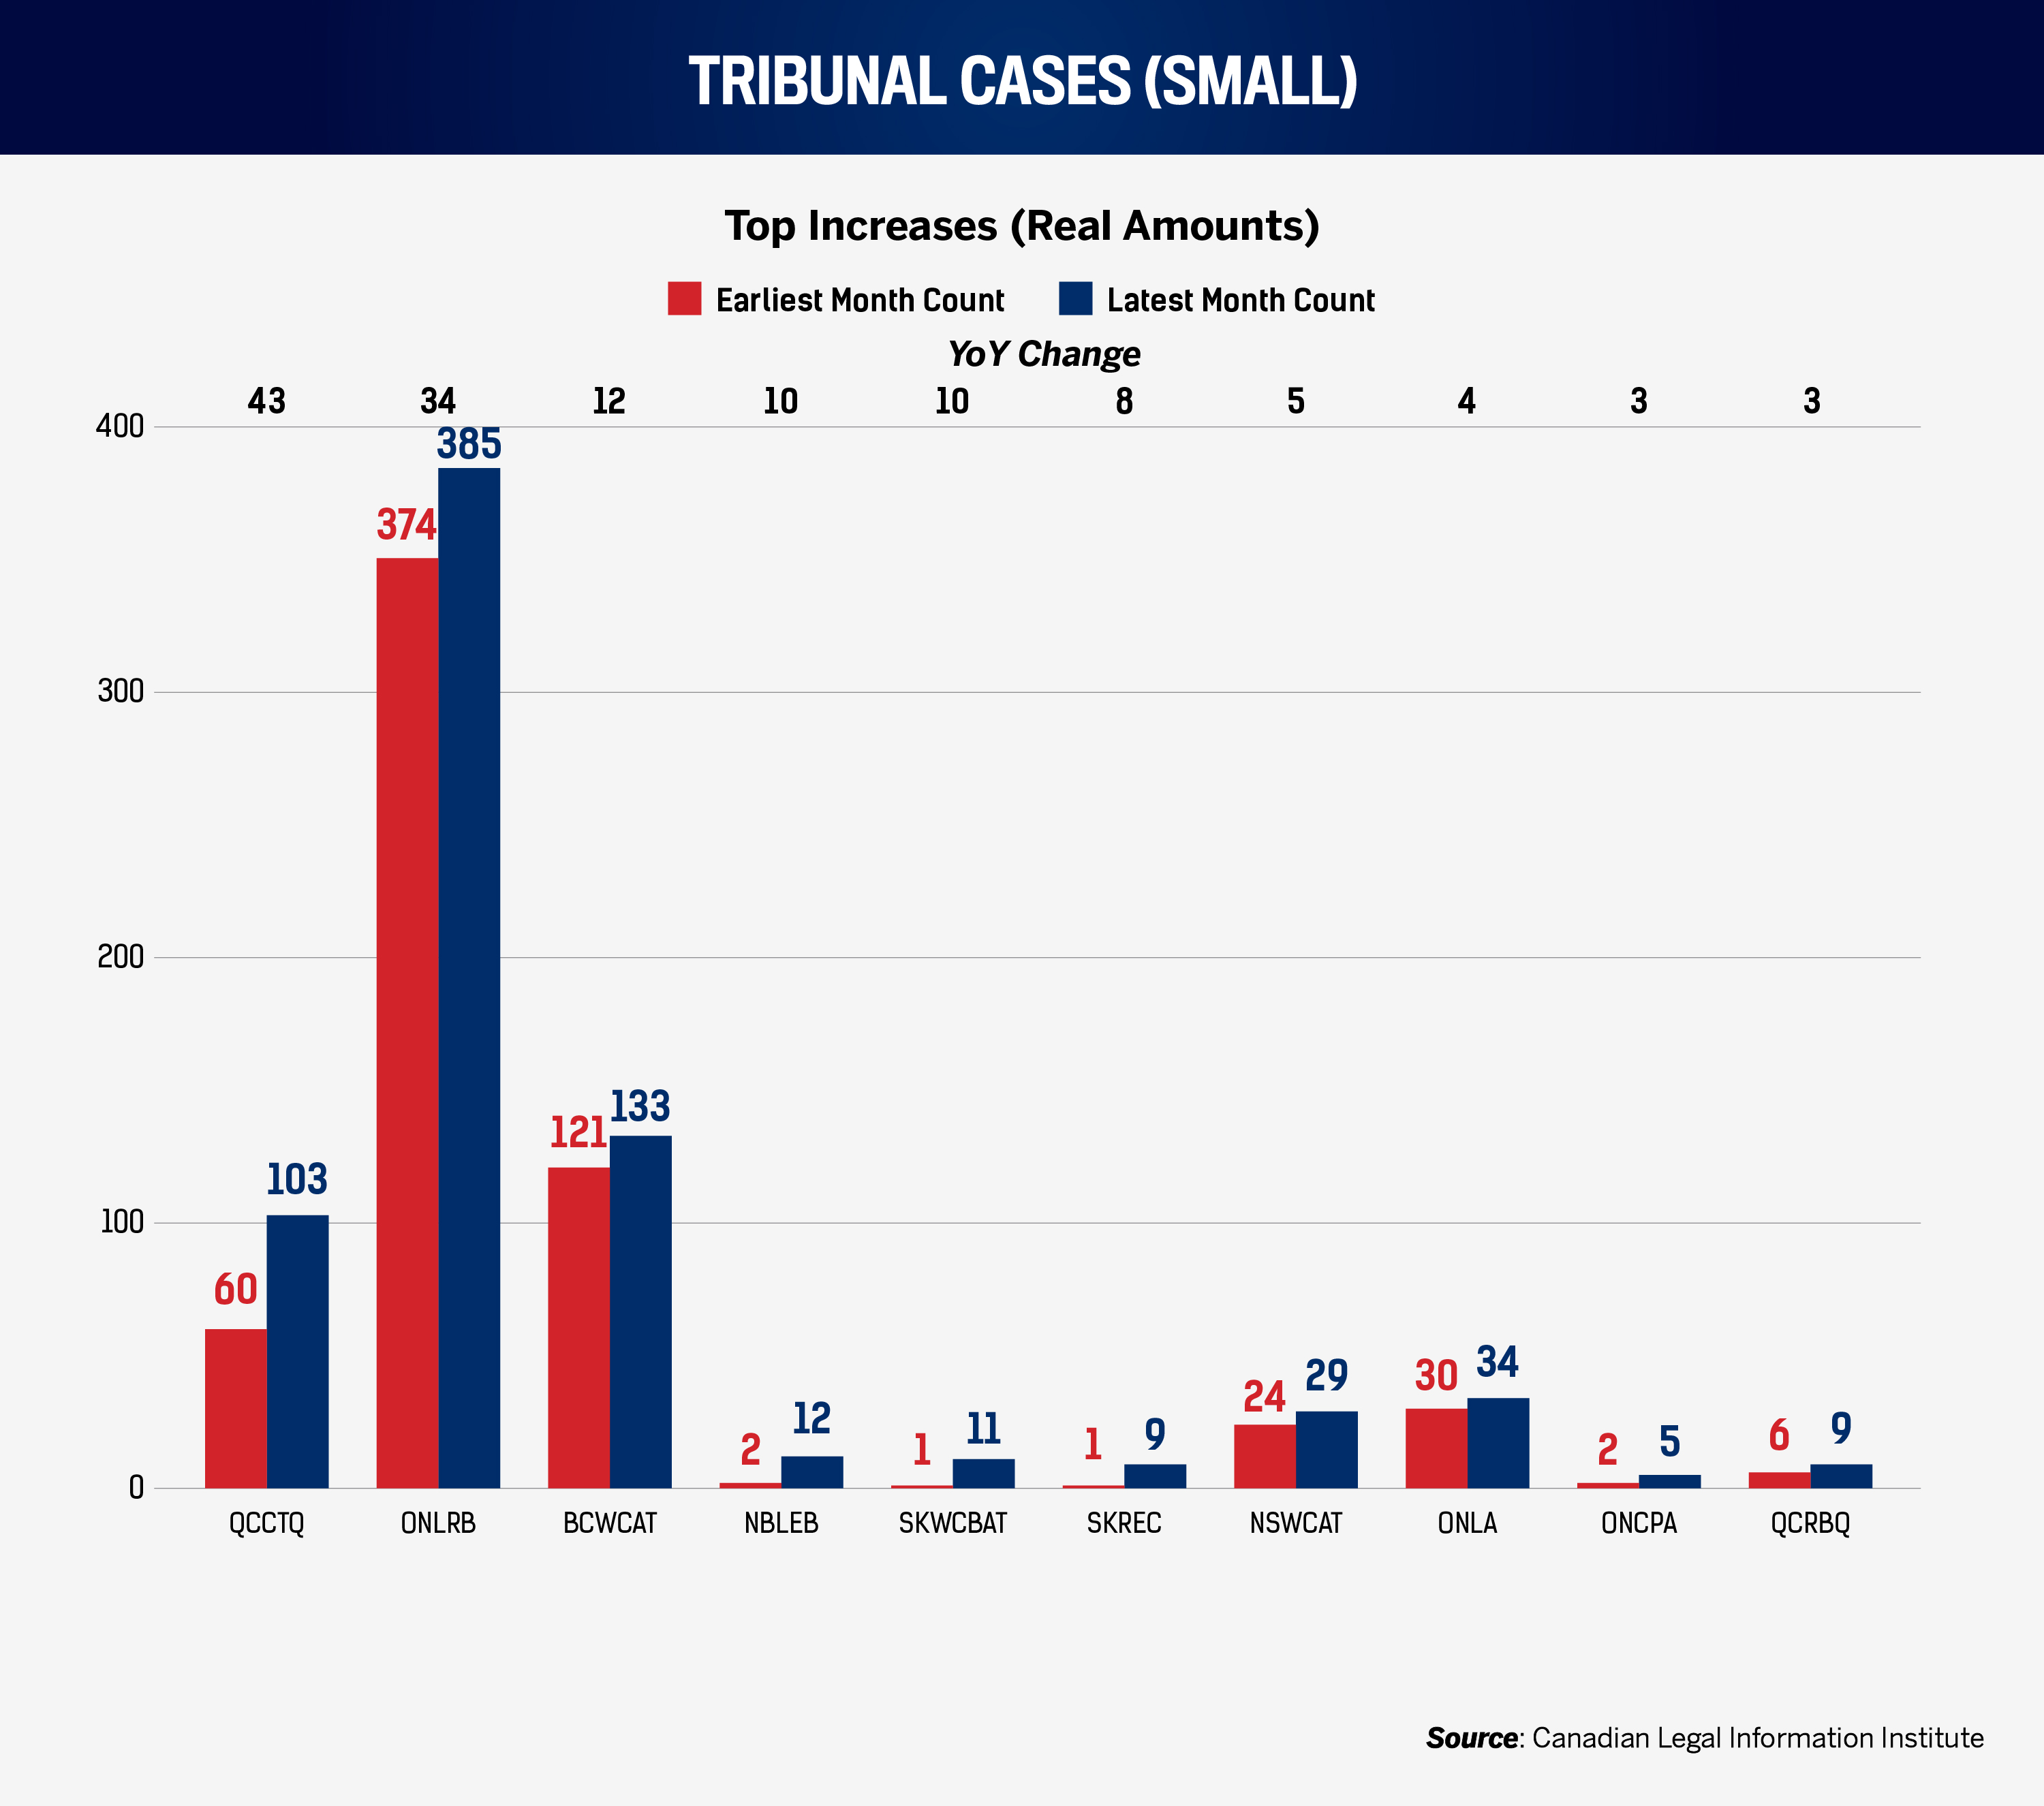
In December 2025, the largest year-on-year rise among the tracked bodies was the Quebec Transportation Board, up 43 cases (60 to 103). This is a specialized jurisdiction with great implications for Quebec’s logistics sector – HR professionals there should increase their awareness of employment standards and regulations. Where operational rules and licensing regimes intersect with discipline, HR must ensure that supervisors can execute procedures consistently.
The Ontario Labour Relations Board (OLRB) faced an increase of 34 cases year-on-year (351 to 385), although the number of cases declined by 39 month-on-month. This is the plain reminder that union-facing processes do not vanish with job vacancies; December’s decision summaries repeatedly reference unions, locals, voting, bargaining units, and administrative mechanics such as email-based communications and applications. As the OLRB recorded higher cases in 2025, cost is avoidable: better training for frontline managers, standard union engagement, and disciplined communication.
Workers’ compensation appeal summaries in British Columbia and Saskatchewan repeatedly focus on benefits eligibility, wage-loss, causation, medical evidence, and return-to-work mechanics, including disputes about whether injuries arose out of employment and how ongoing symptoms should be assessed.
Cases at the British Columbia Workers’ Compensation Appeal Tribunal increased by 12 (121 to 133), and those at the Saskatchewan Workers’ Compensation Board Appeal Tribunal by 10 (1 to 11, from a small base). According to decision summaries, the most expensive failures are predictable: missing notes, inconsistent restrictions handling, and unclear communication between line managers, claims administrators, and employees.
4. Workforce
4.A. National working population trend
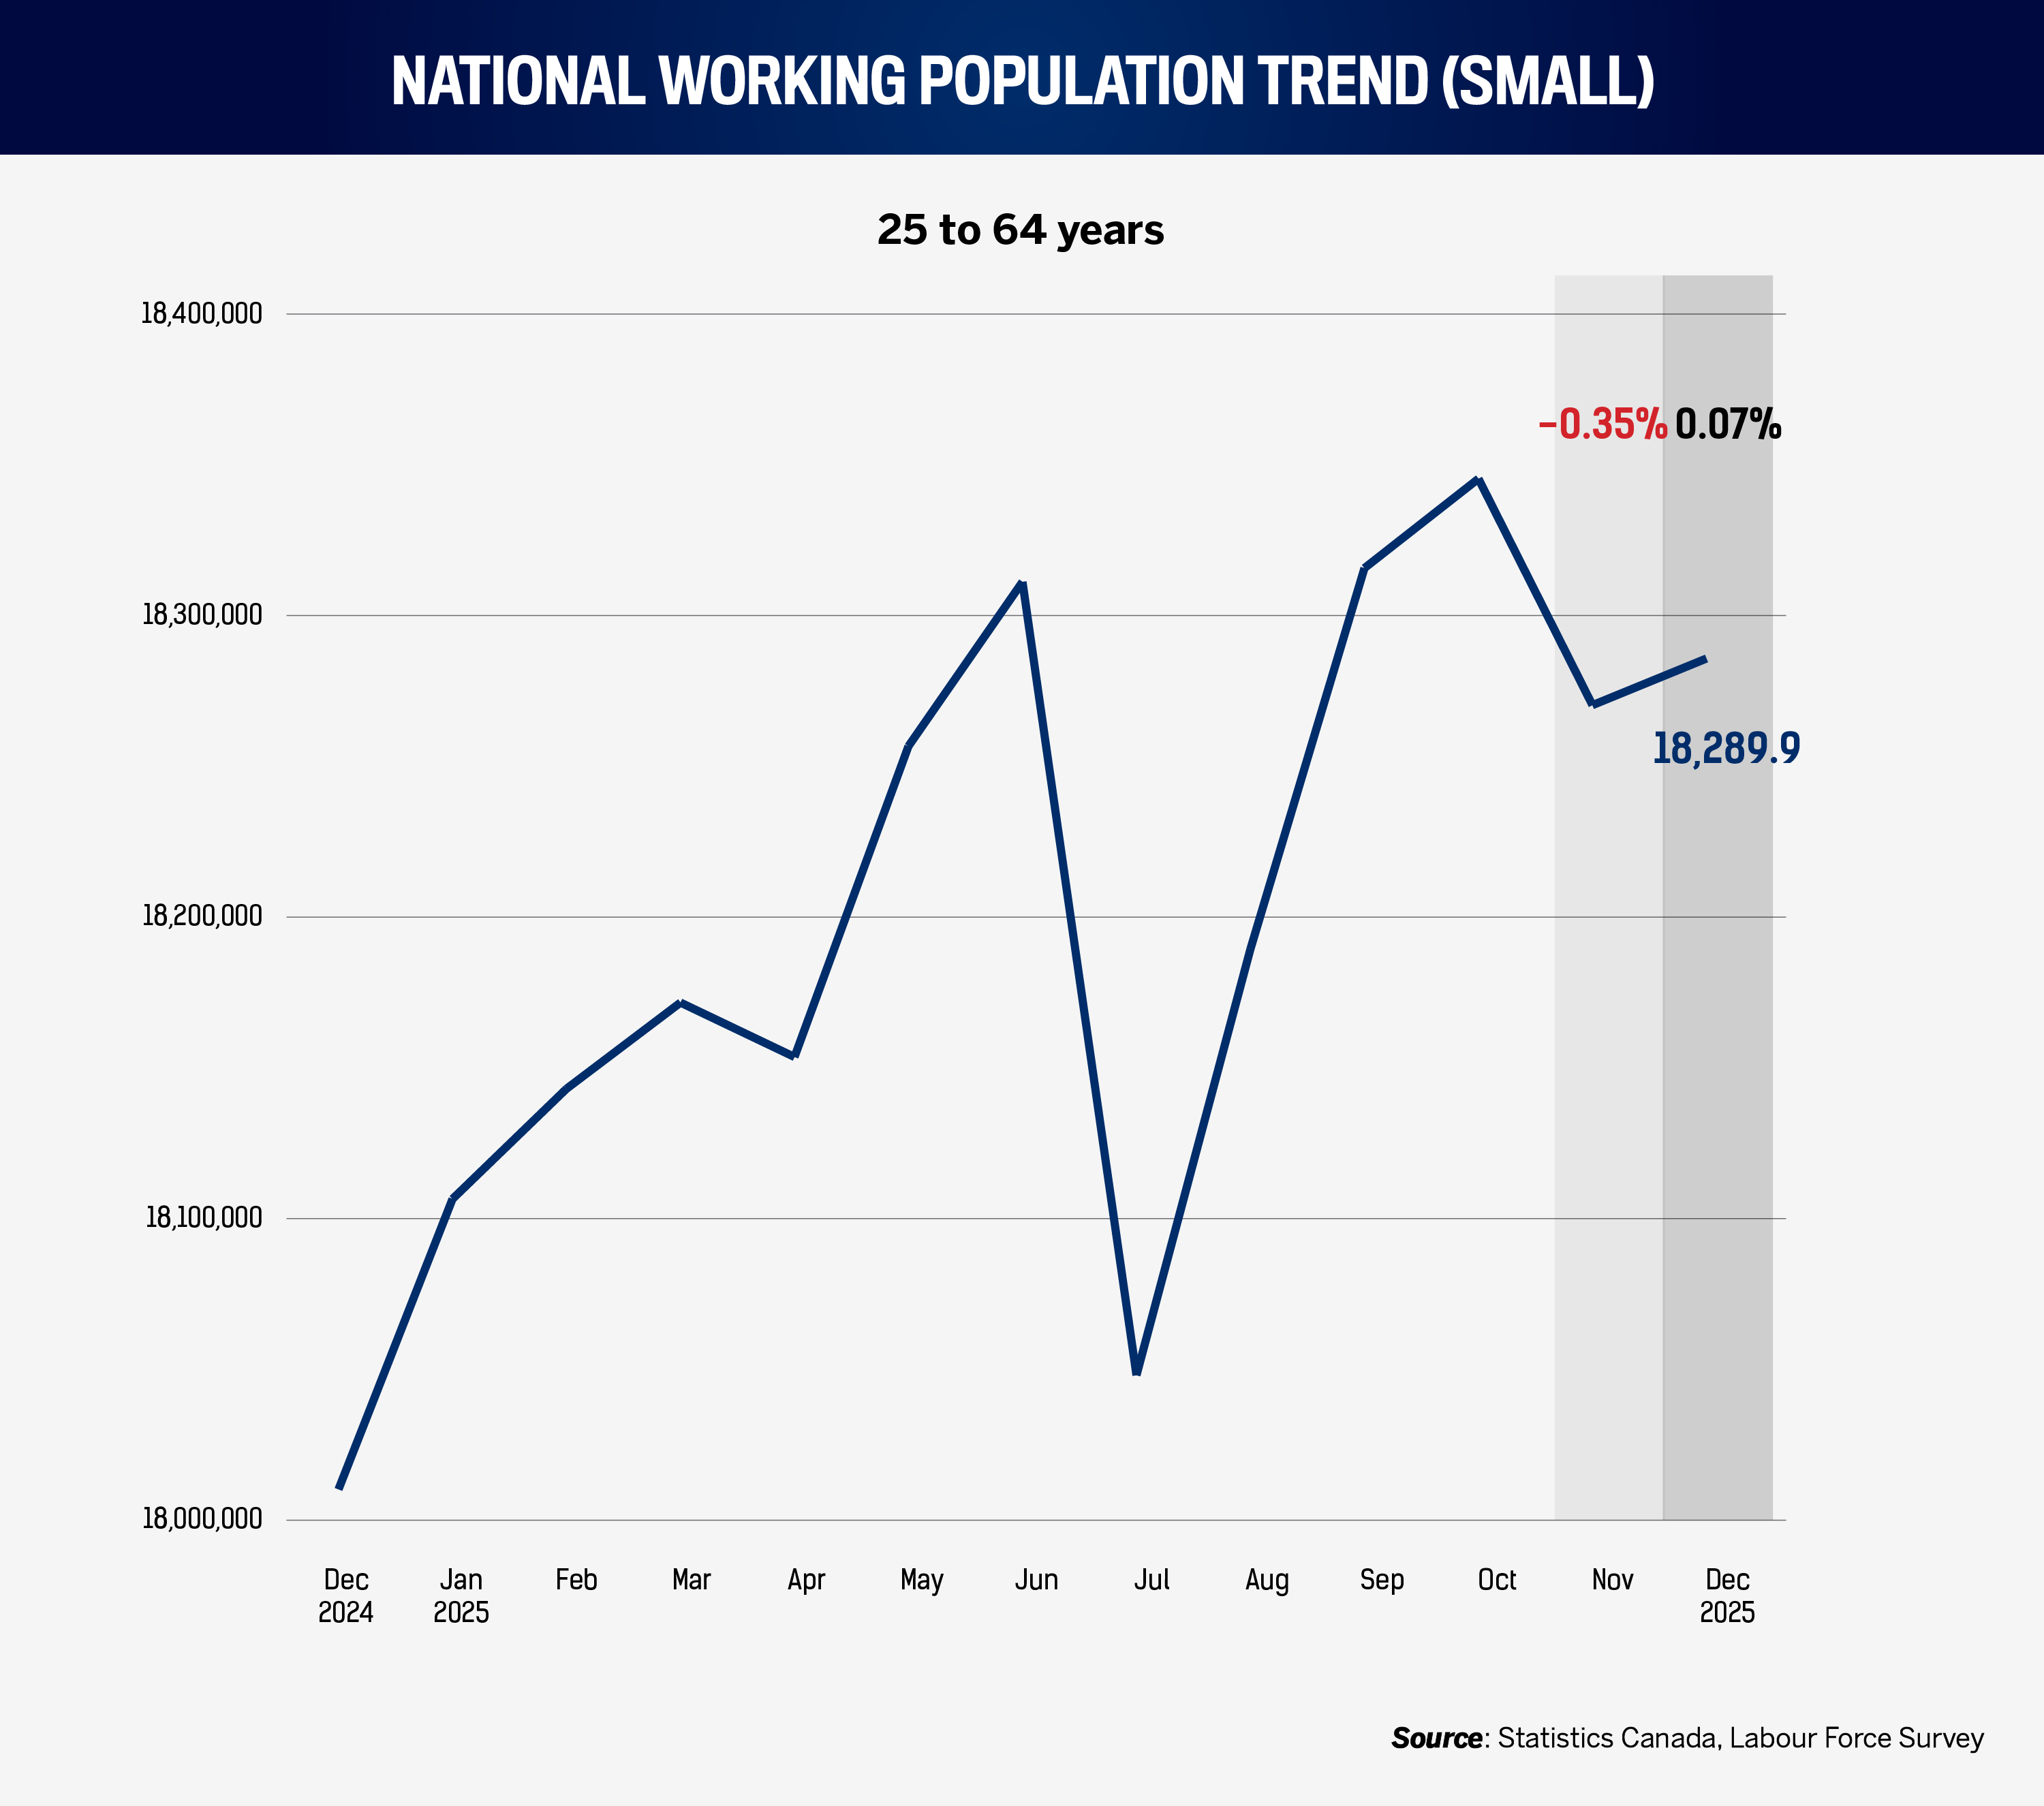
By December 2025, the prime-age labour force reached 18,289,900, up 1.3 percent from December 2024. Month-on-month growth was +0.07 percent, the lowest monthly increase during a year of three monthly decreases. Nationwide, 2025 labour force growth was not explosive, but was persistent, averaging +0.1 percent each month. In basic HR terms, persistent supply growth means longer shortlists, more “meets minimum” candidates, and a greater need to differentiate on judgment and job readiness.
The interaction with vacancies and payroll is the key strategic point. Available jobs were down 11.3 percent year-on-year by November 2025, while payroll employees were up 0.5 percent. Canada’s labour supply growth does not automatically fix specialist scarcity. The labour force can expand while certain credentials remain rare. This is where HR should link workforce planning to the wage signals in Section 2.B. If utilities, finance and other industries’ wages are rising stronger than others, it suggests continued pressure in skills that are slow to train. The right response is not panic hiring, but structured internal pathways, better apprenticeship or credential support, and clearer progression for mid-skill employees who can be developed into scarce-skill categories.
4.B. Provincial and city workforce changes
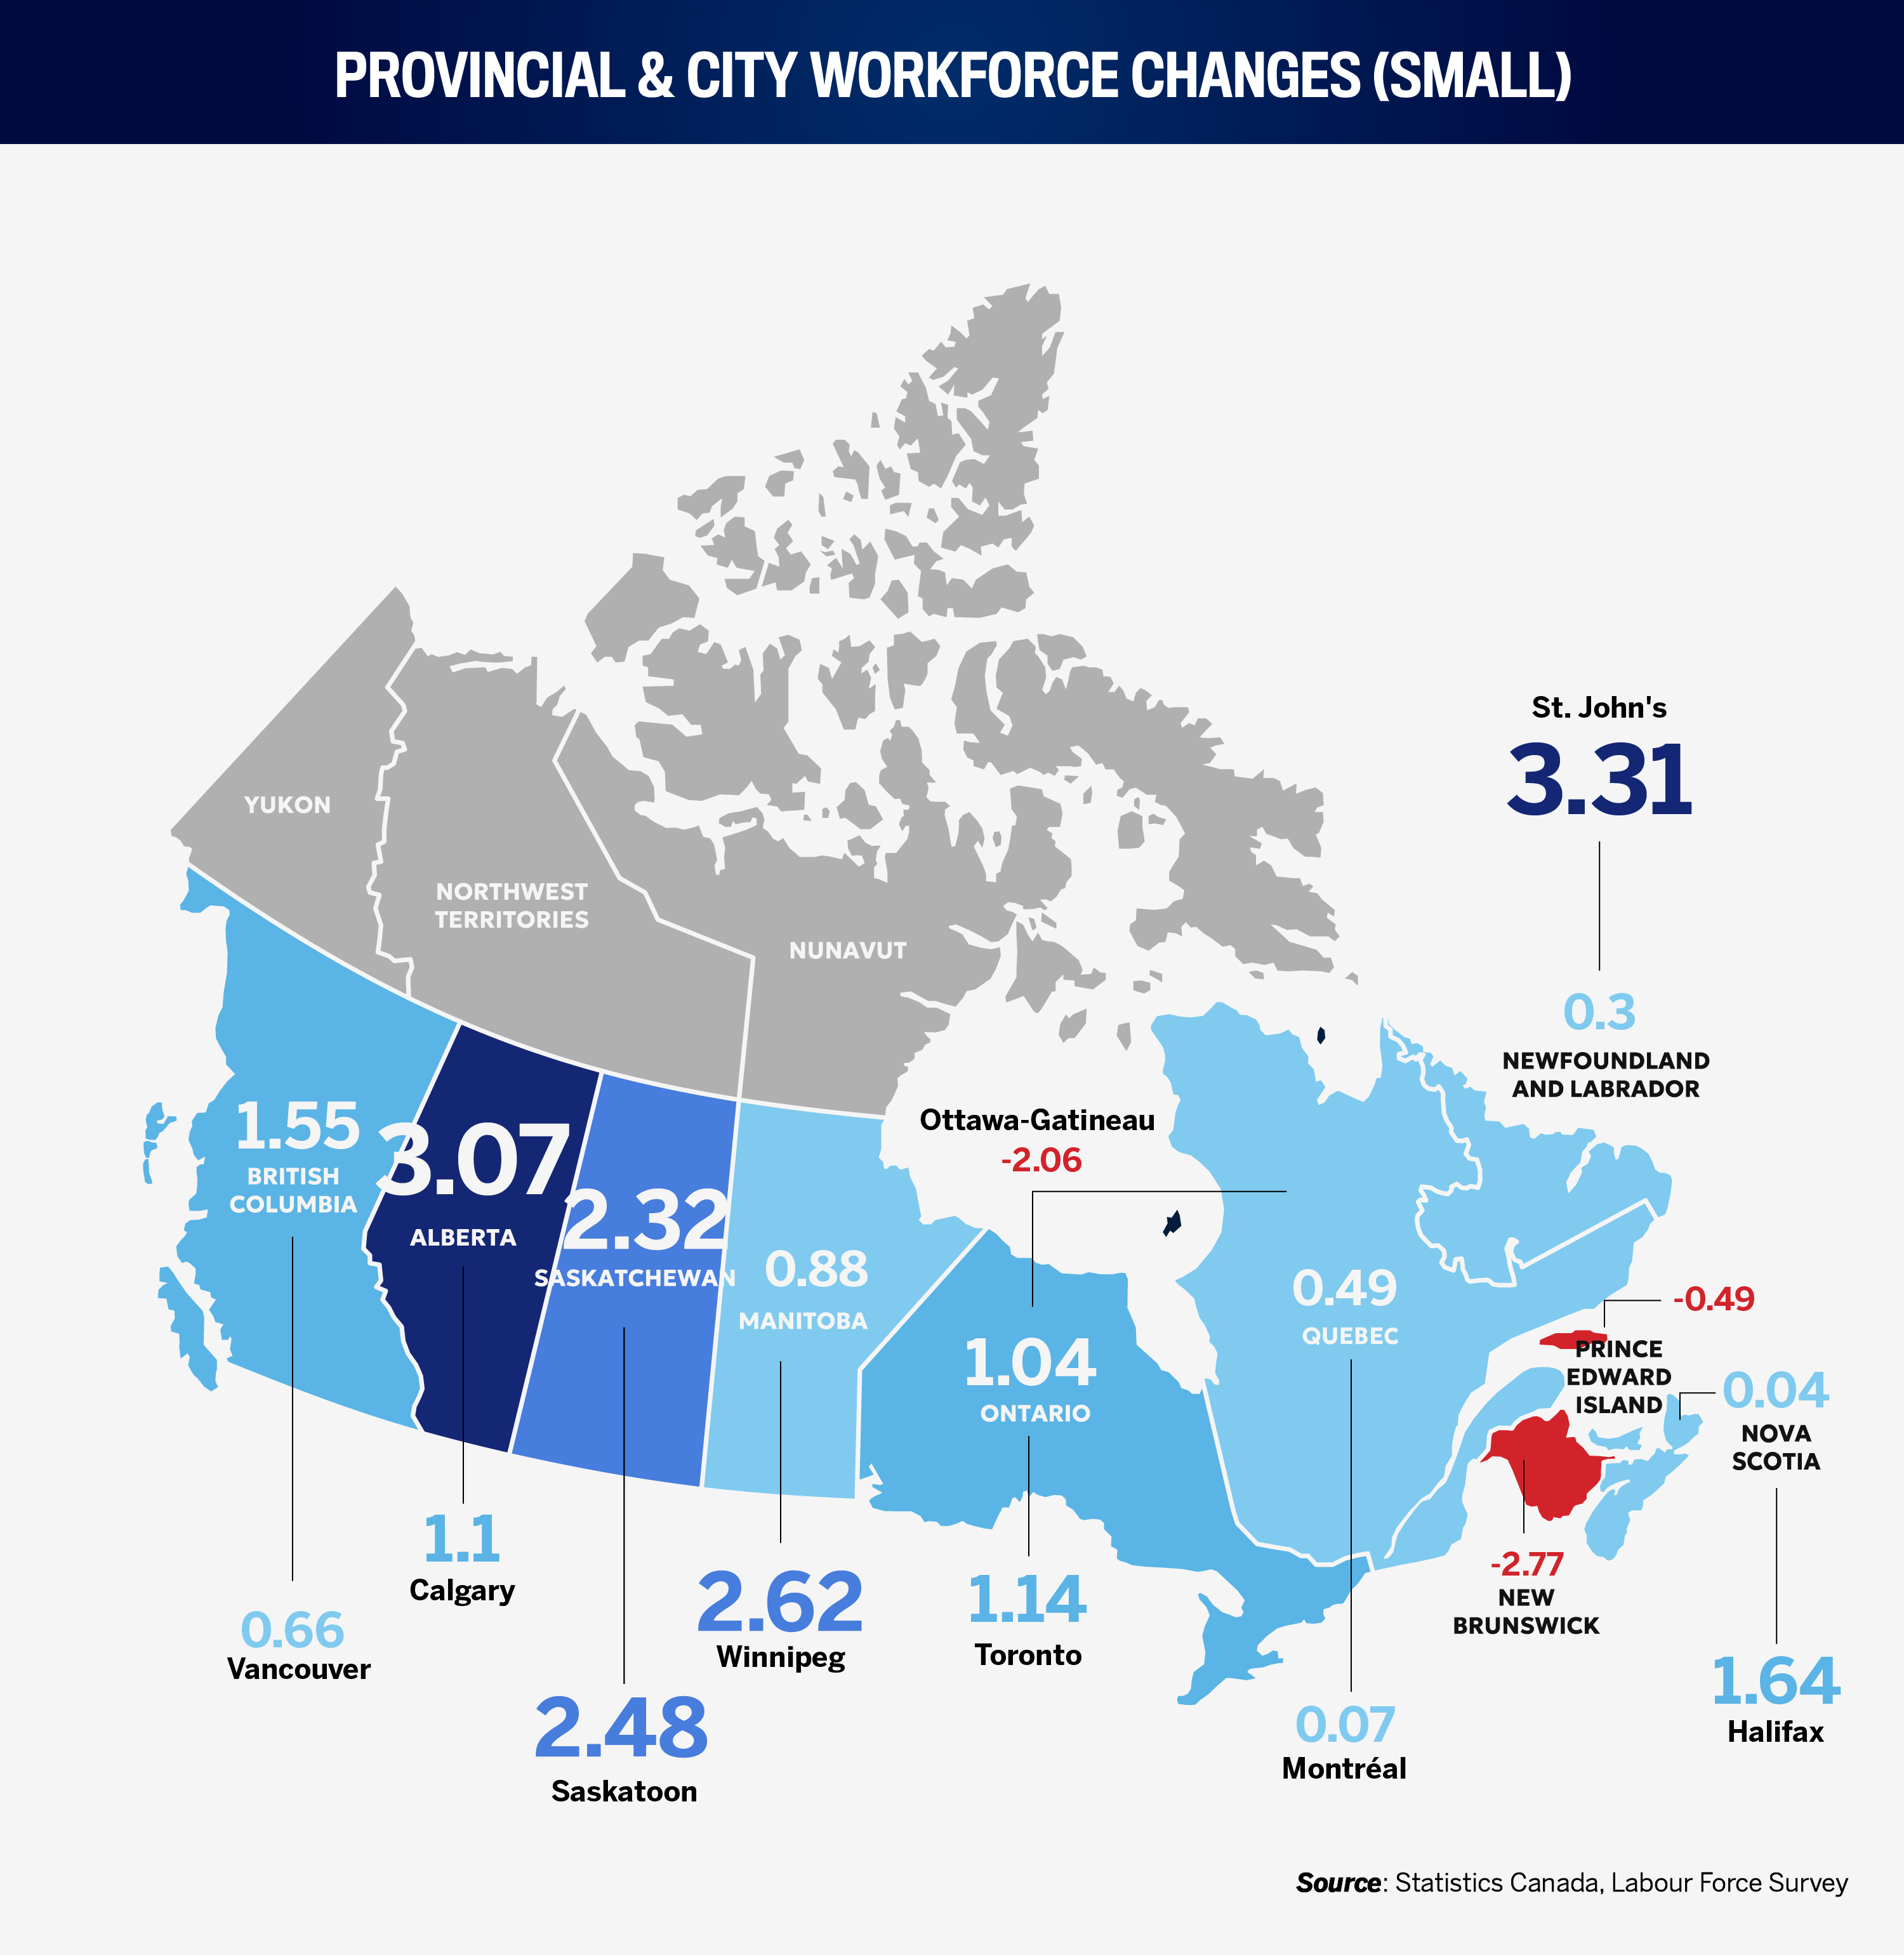
In December, among provinces, Alberta posted impressive +3.1 percent year-on-year labour growth, adding 83,700 to reach 2,812,000. Nevertheless, the province was down 1,500 workers month-on-month. Saskatchewan rose +2.3 percent (+14,800) year-on-year, and British Columbia +1.6 percent (+47,700). Beyond regional demographics, this affects where HR leaders can build entry-level pipelines fastest, and where competition for experienced hires may remain stubborn.
City patterns refine the picture. St. John’s, Newfoundland, grew +3.3 percent (+4,400), Winnipeg +2.6 percent (+13,900), and Saskatoon +2.5 percent (+5,300). These are meaningful changes in local labour availability. HR can use them tactically by broadening sourcing radii, piloting remote or hybrid arrangements tied to these markets, and rethinking where support functions sit.
The cautionary signal is the downside. Ottawa–Gatineau fell -2.1 percent (-19,400), while Saint John, New Brunswick, fell -2.8 percent (-2,000). In contracting markets, retention and internal mobility become more valuable than external hiring, even when national vacancies are easing.
The most practical cross-reference is to tribunal risk (Section 4). When organizations recruit across jurisdictions and grow unevenly, procedural consistency breaks first with different managers applying different standards. Regional divergence strengthens the case for national frameworks with local tailoring, not local autonomy without guardrails.
5. Unemployment
5.A. General unemployment by gender
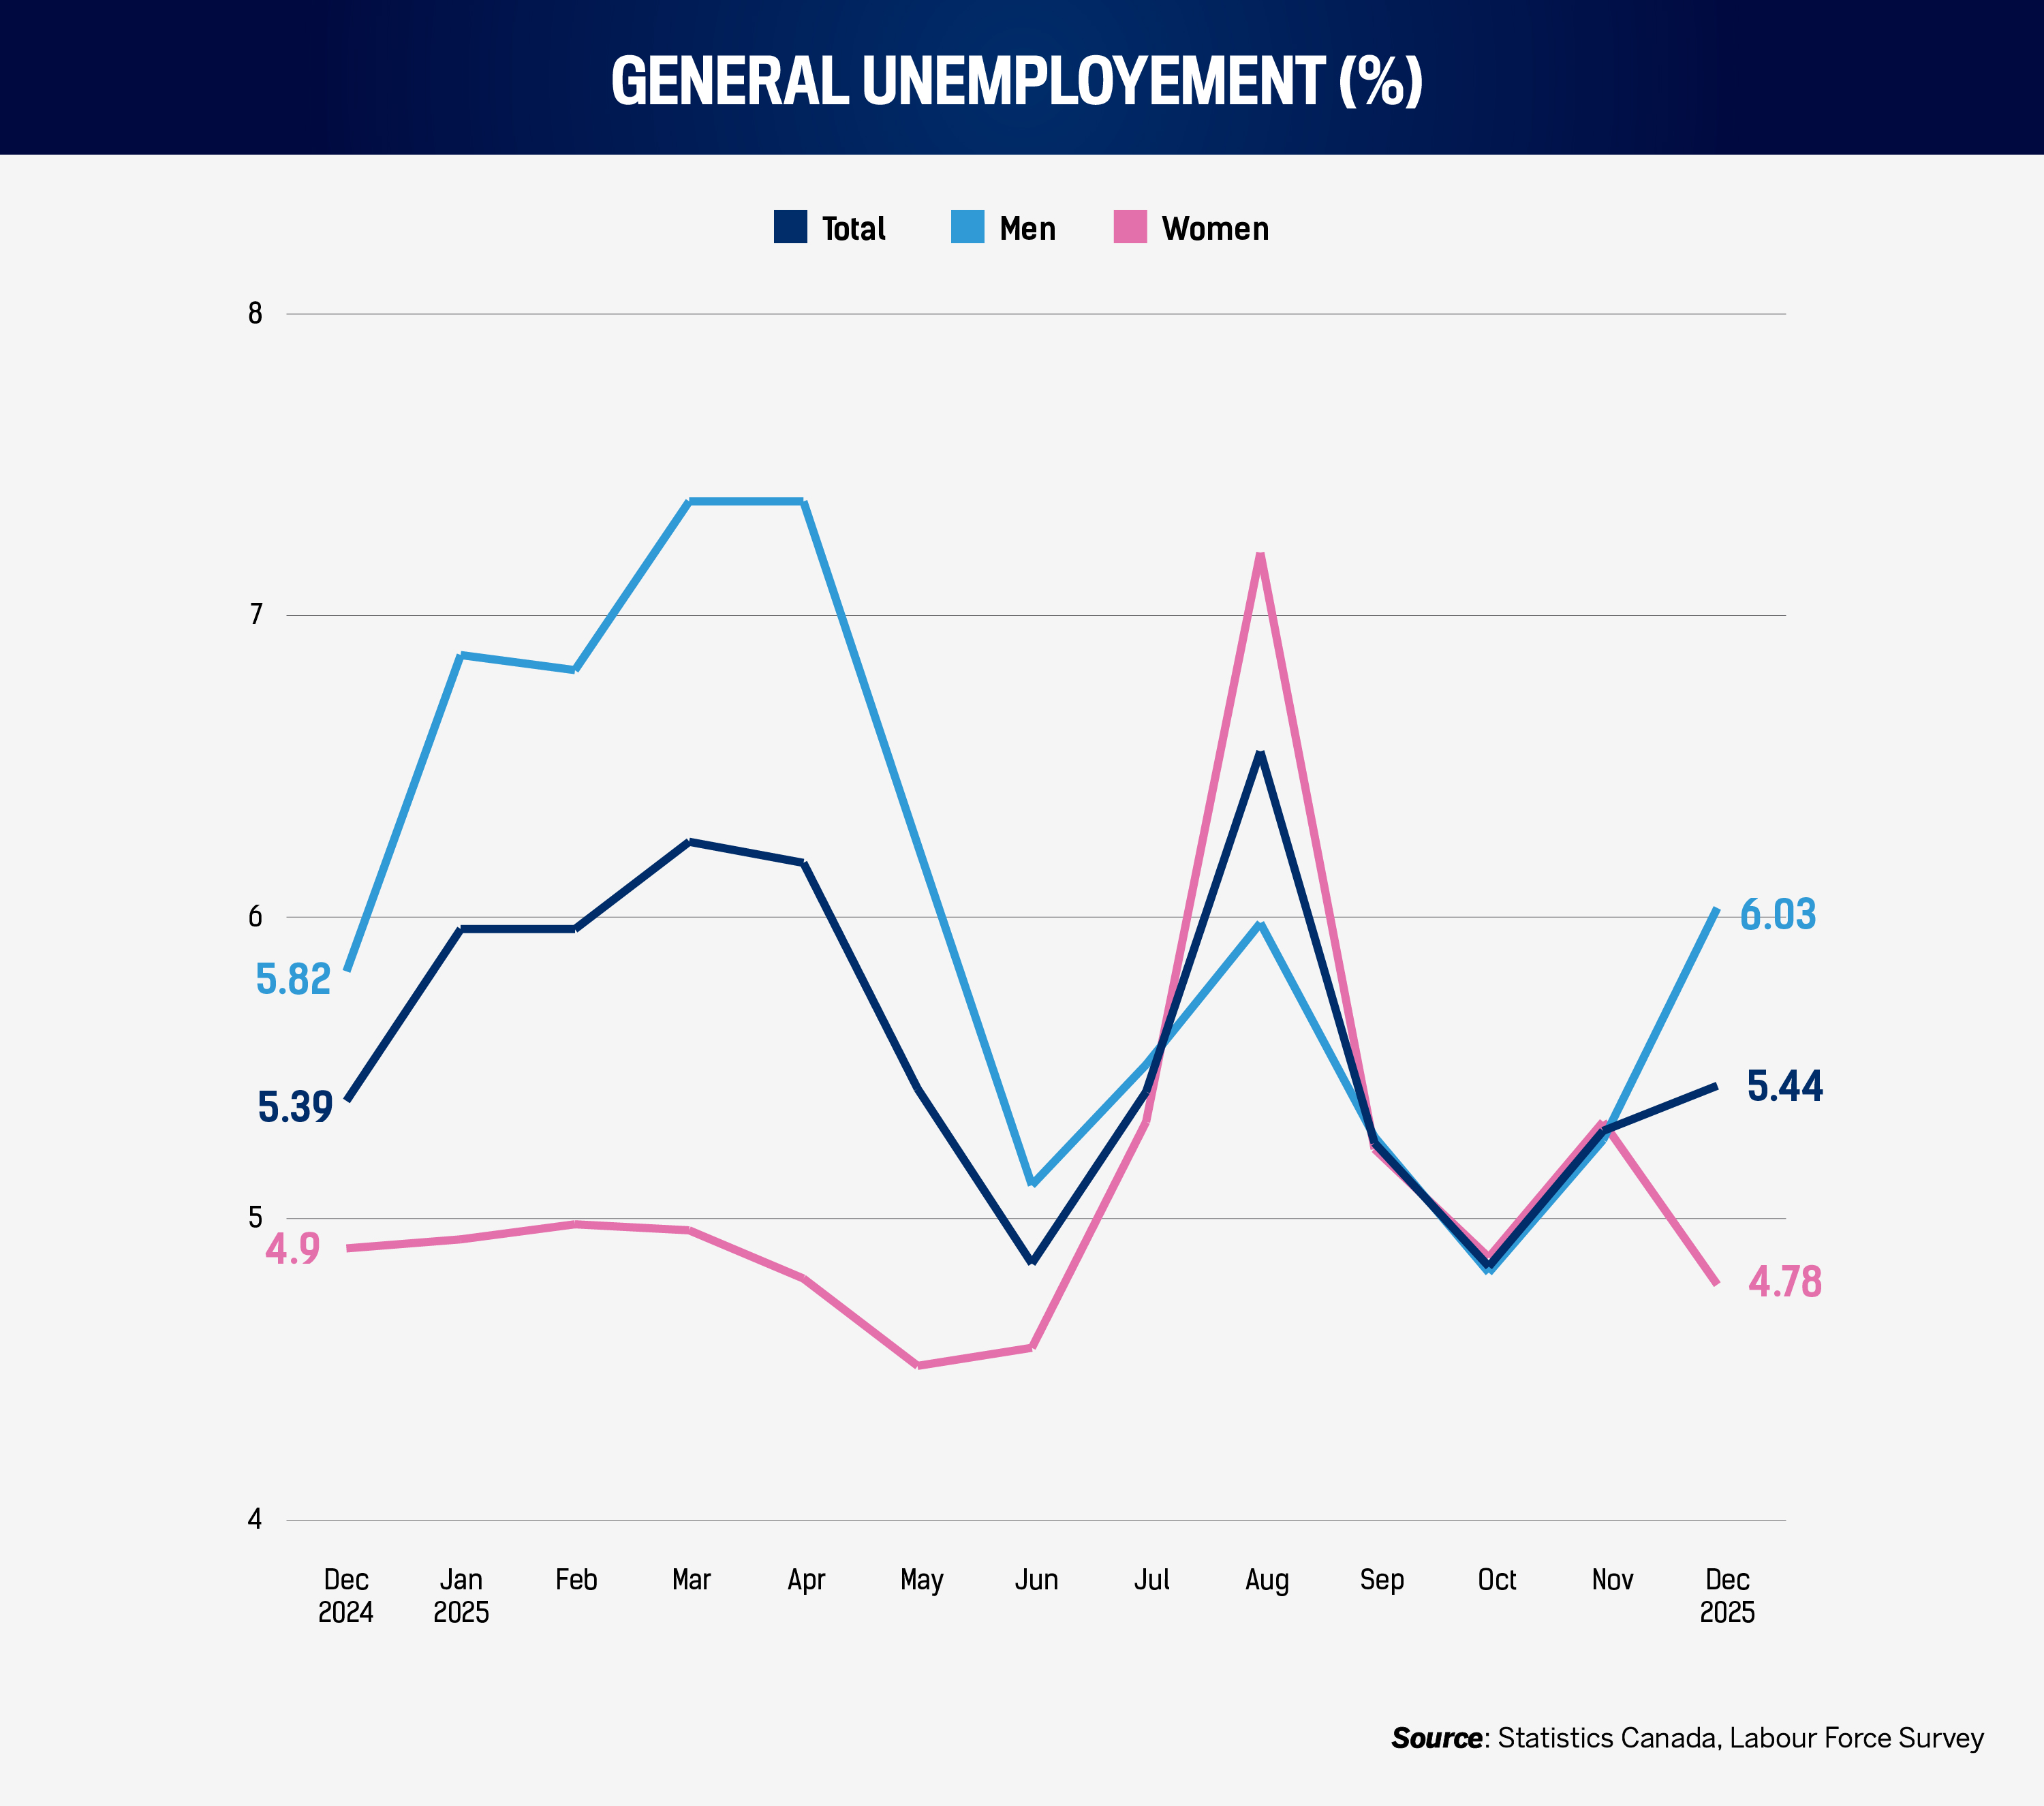
The unemployment is stable, but not flat. In December 2025, prime-age unemployment was 5.44 percent, essentially unchanged from December 2024. This aligns with Section 1.A’s signal: vacancies cooled, but payroll employment did not collapse. Organizations are hiring less aggressively, but they are not shedding staff en masse.
The gender split is operationally important. Men’s unemployment rose 0.2 points to 6.03 percent, while women’s fell 0.1 points to 4.78 percent. HR leaders should avoid simplistic narratives about “the labour market” as a single condition. When gender splits move, so do candidate pools, internal retention dynamics, and the likely distribution of caregiving constraints and availability for shift-based work.
The intra-year peak in total unemployment was August 2025 (6.55 percent), and women’s peak was also August 2025 (7.21 percent). Even if the year ends near where it began, the mid-year stress can be the moment when hiring freezes, restructuring, or funding cycles trigger churn. Therefore, HR planning should be set up to absorb volatility: maintain recruitment capacity for critical roles, keep training pipelines active, and avoid overcorrecting compensation based on a single quarter’s conditions.
5.B. Unemployment by age and education
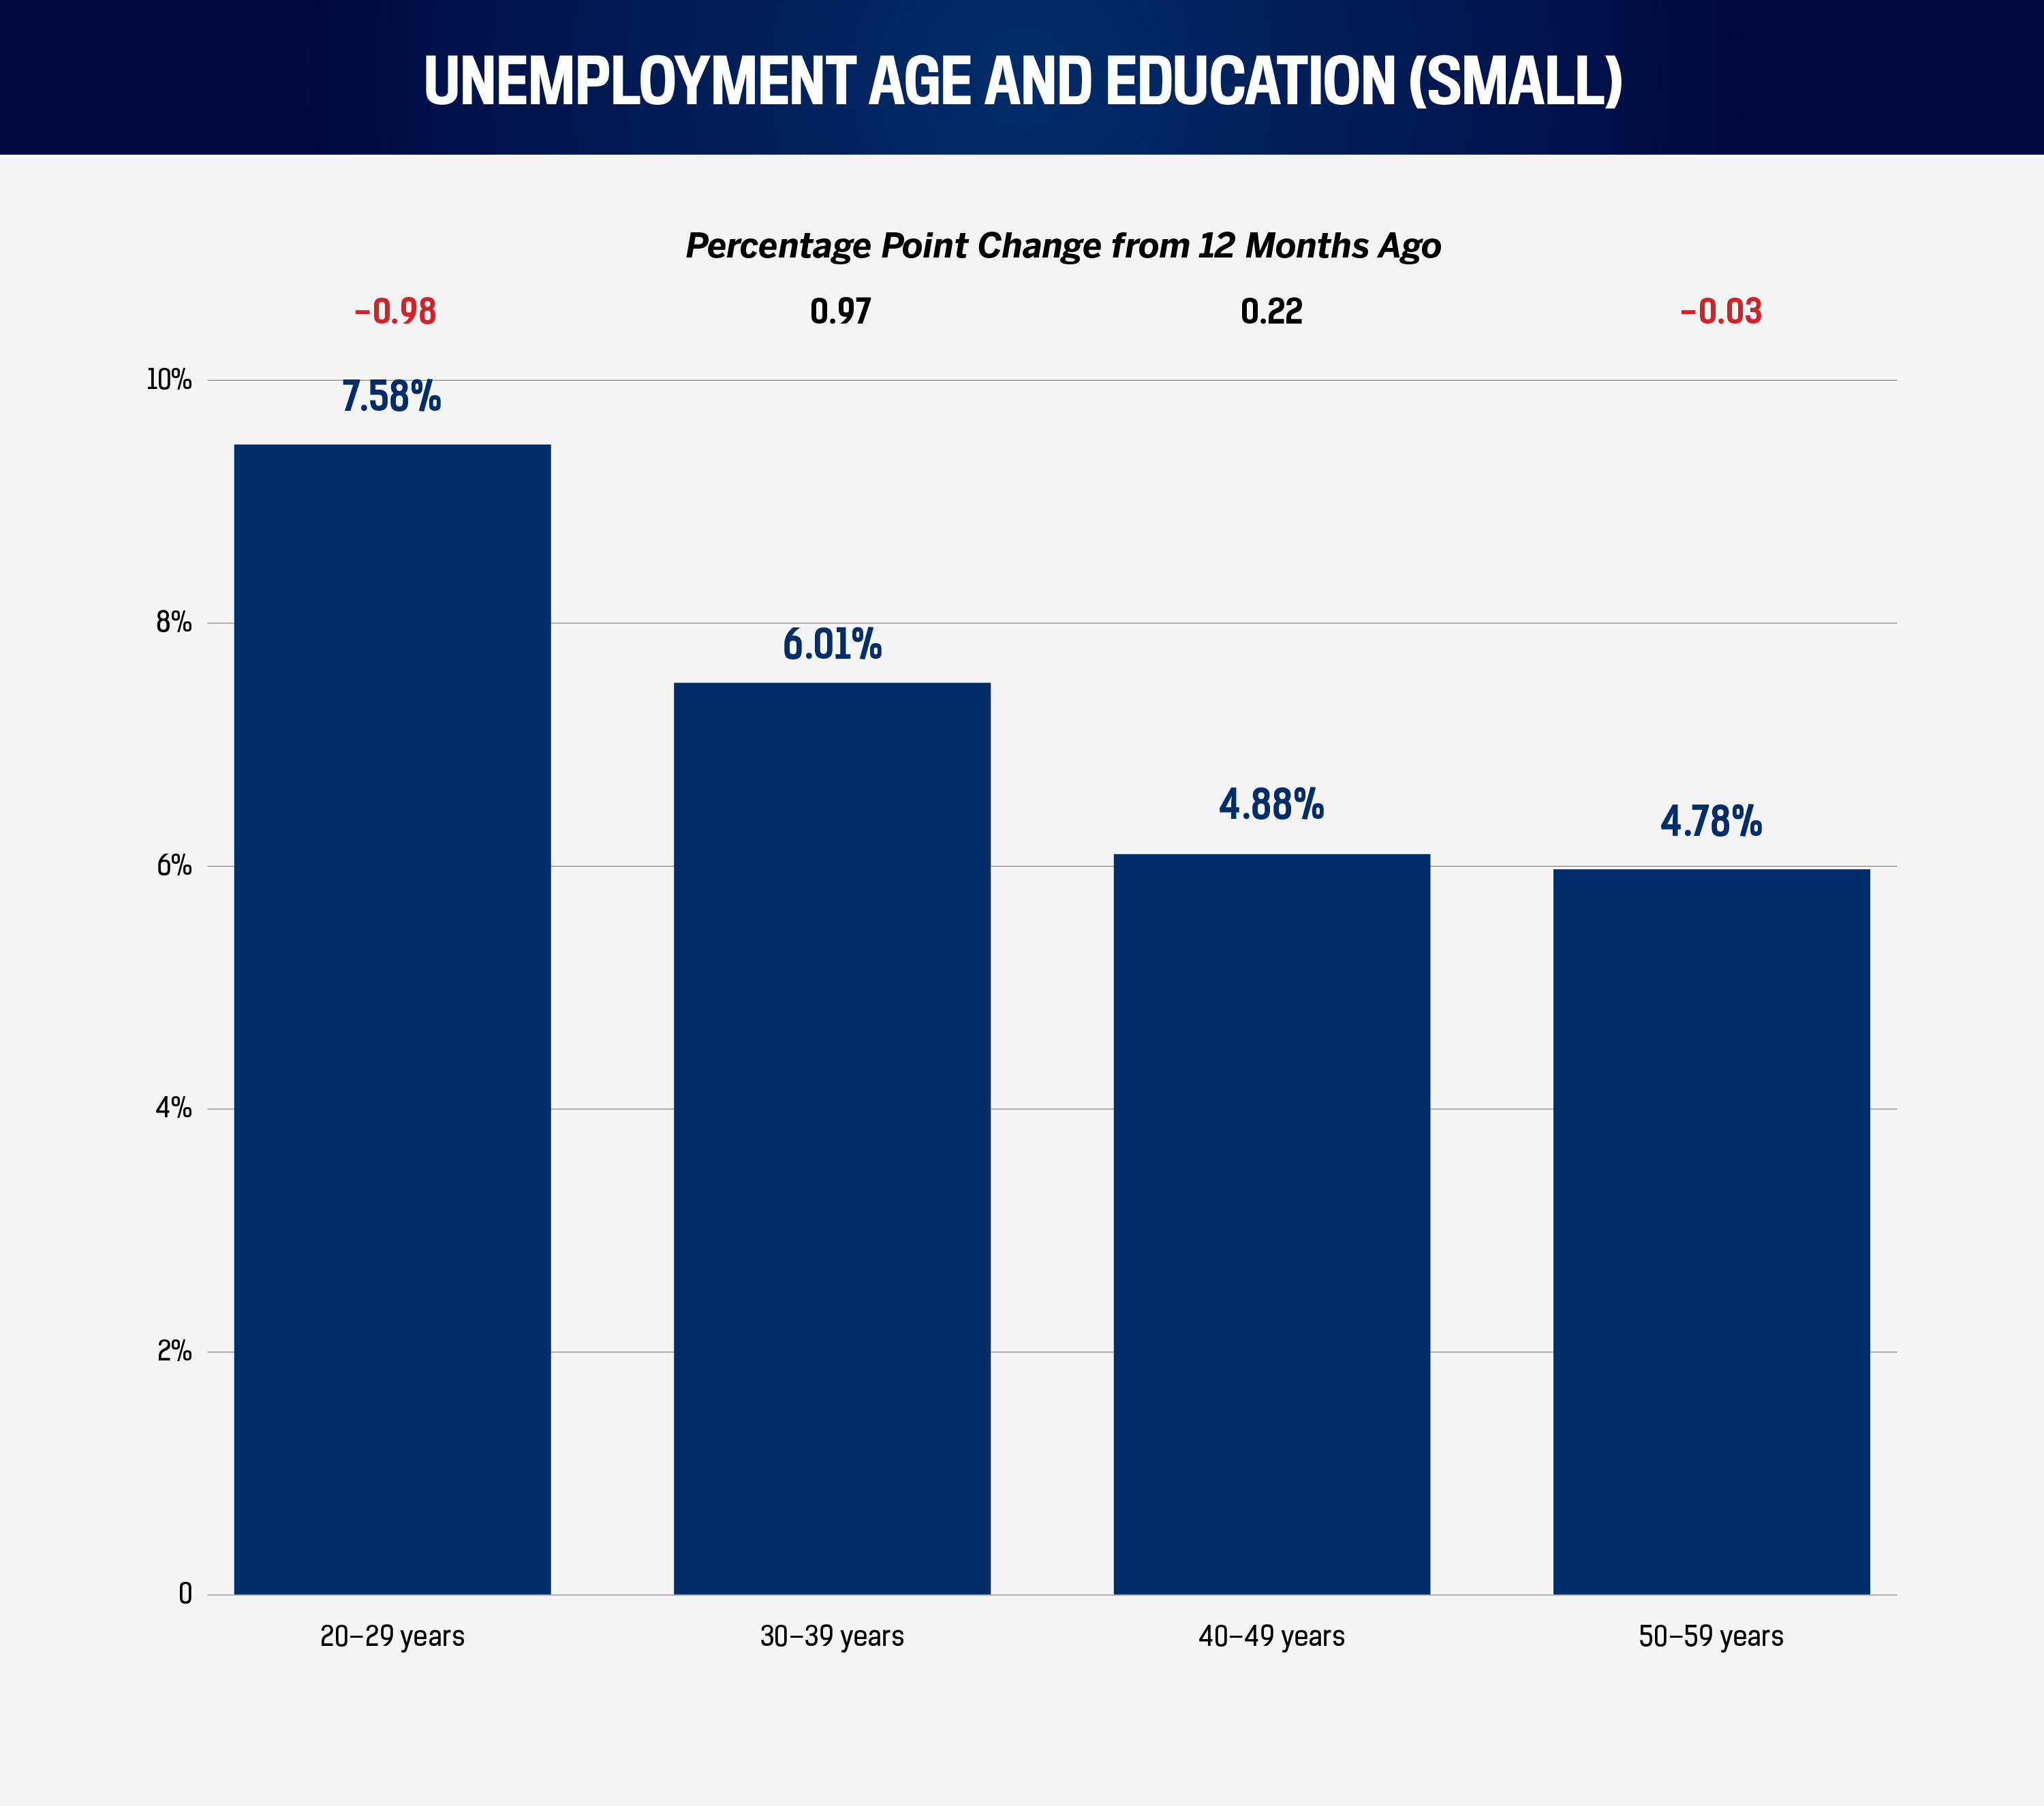
Age splits tell HR where pressure will surface first. In December 2025, unemployment among 20–29-year-olds was 7.6 percent, down from 8.6 percent in December 2024. That should deepen entry-level candidate pools, but it also increases the burden on HR to screen for readiness and to build training that accelerates productivity. A larger pipeline of junior candidates is only an advantage if the organization can convert it into capability.
The standouts are 30–39-year-olds, rising from 5.0 percent to 6 percent year-on-year. This matters because this cohort often carries management-track talent, technical specialists, and people with higher financial commitments. When their unemployment rises in a cooling vacancy market (Section 1.A), HR should expect sharper sensitivity to perceived unfairness: stalled progression, opaque pay decisions, and uneven workload allocation. Those are the conditions that, unmanaged, translate into exits (Section 3) and disputes (Section 4).
For the 40–49 and 50–59 age groups, changes were smaller. HR should not read this trend as “no risk”. It suggests that older cohorts remain relatively insulated, which can create internal tension if organizations over-index development and opportunity toward one older group without plans to shore up succession or invest in new talent.


