Canada’s labour market has been cooling decisively, with job vacancies continuing to fall year on year, signalling an end to the post-pandemic era of broad, urgent hiring. Yet pockets of strength remain: “other services” and manufacturing have recently added openings, while information and tech-related industries now show alarming vacancy declines.

Strategic HR, January 2026 Edition
Job vacancies and unemployment continue to fall as wages hold strong; HR pros gain breathing room to play to their strengths
Canada’s labour market has been cooling decisively, with job vacancies continuing to fall year on year, signalling an end to the post-pandemic era of broad, urgent hiring. Yet pockets of strength remain: “other services” and manufacturing have recently added openings, while information and tech-related industries now show alarming vacancy declines.
Wages are largely flat in nominal terms, but slow inflation means real purchasing power has inched higher – a subtle but important shift that HR leaders should mind carefully. Utilities, finance, and education stand out with striking recent pay gains.
Unemployment is easing lower overall, but not for everyone. Recently, it has risen among workers in their 30s and those with only a bachelor’s degree. The risk for HR leaders is a growing misalignment between pay, progression, and which groups feel most exposed in a more selective labour market.
Executive overview
- Job vacancies have fallen sharply, giving employers more bargaining power and room to be selective.
- Real wages have improved modestly, driven more by weak inflation than by strong pay growth.
- Tenure is eroding in several white-collar and service sectors, even as tribunal cases increase.
- The labour force is still expanding, especially in Western Canada.
- Unemployment is down overall, yet rising for some mid-career and mid-credential workers, reshaping where HR risk sits.
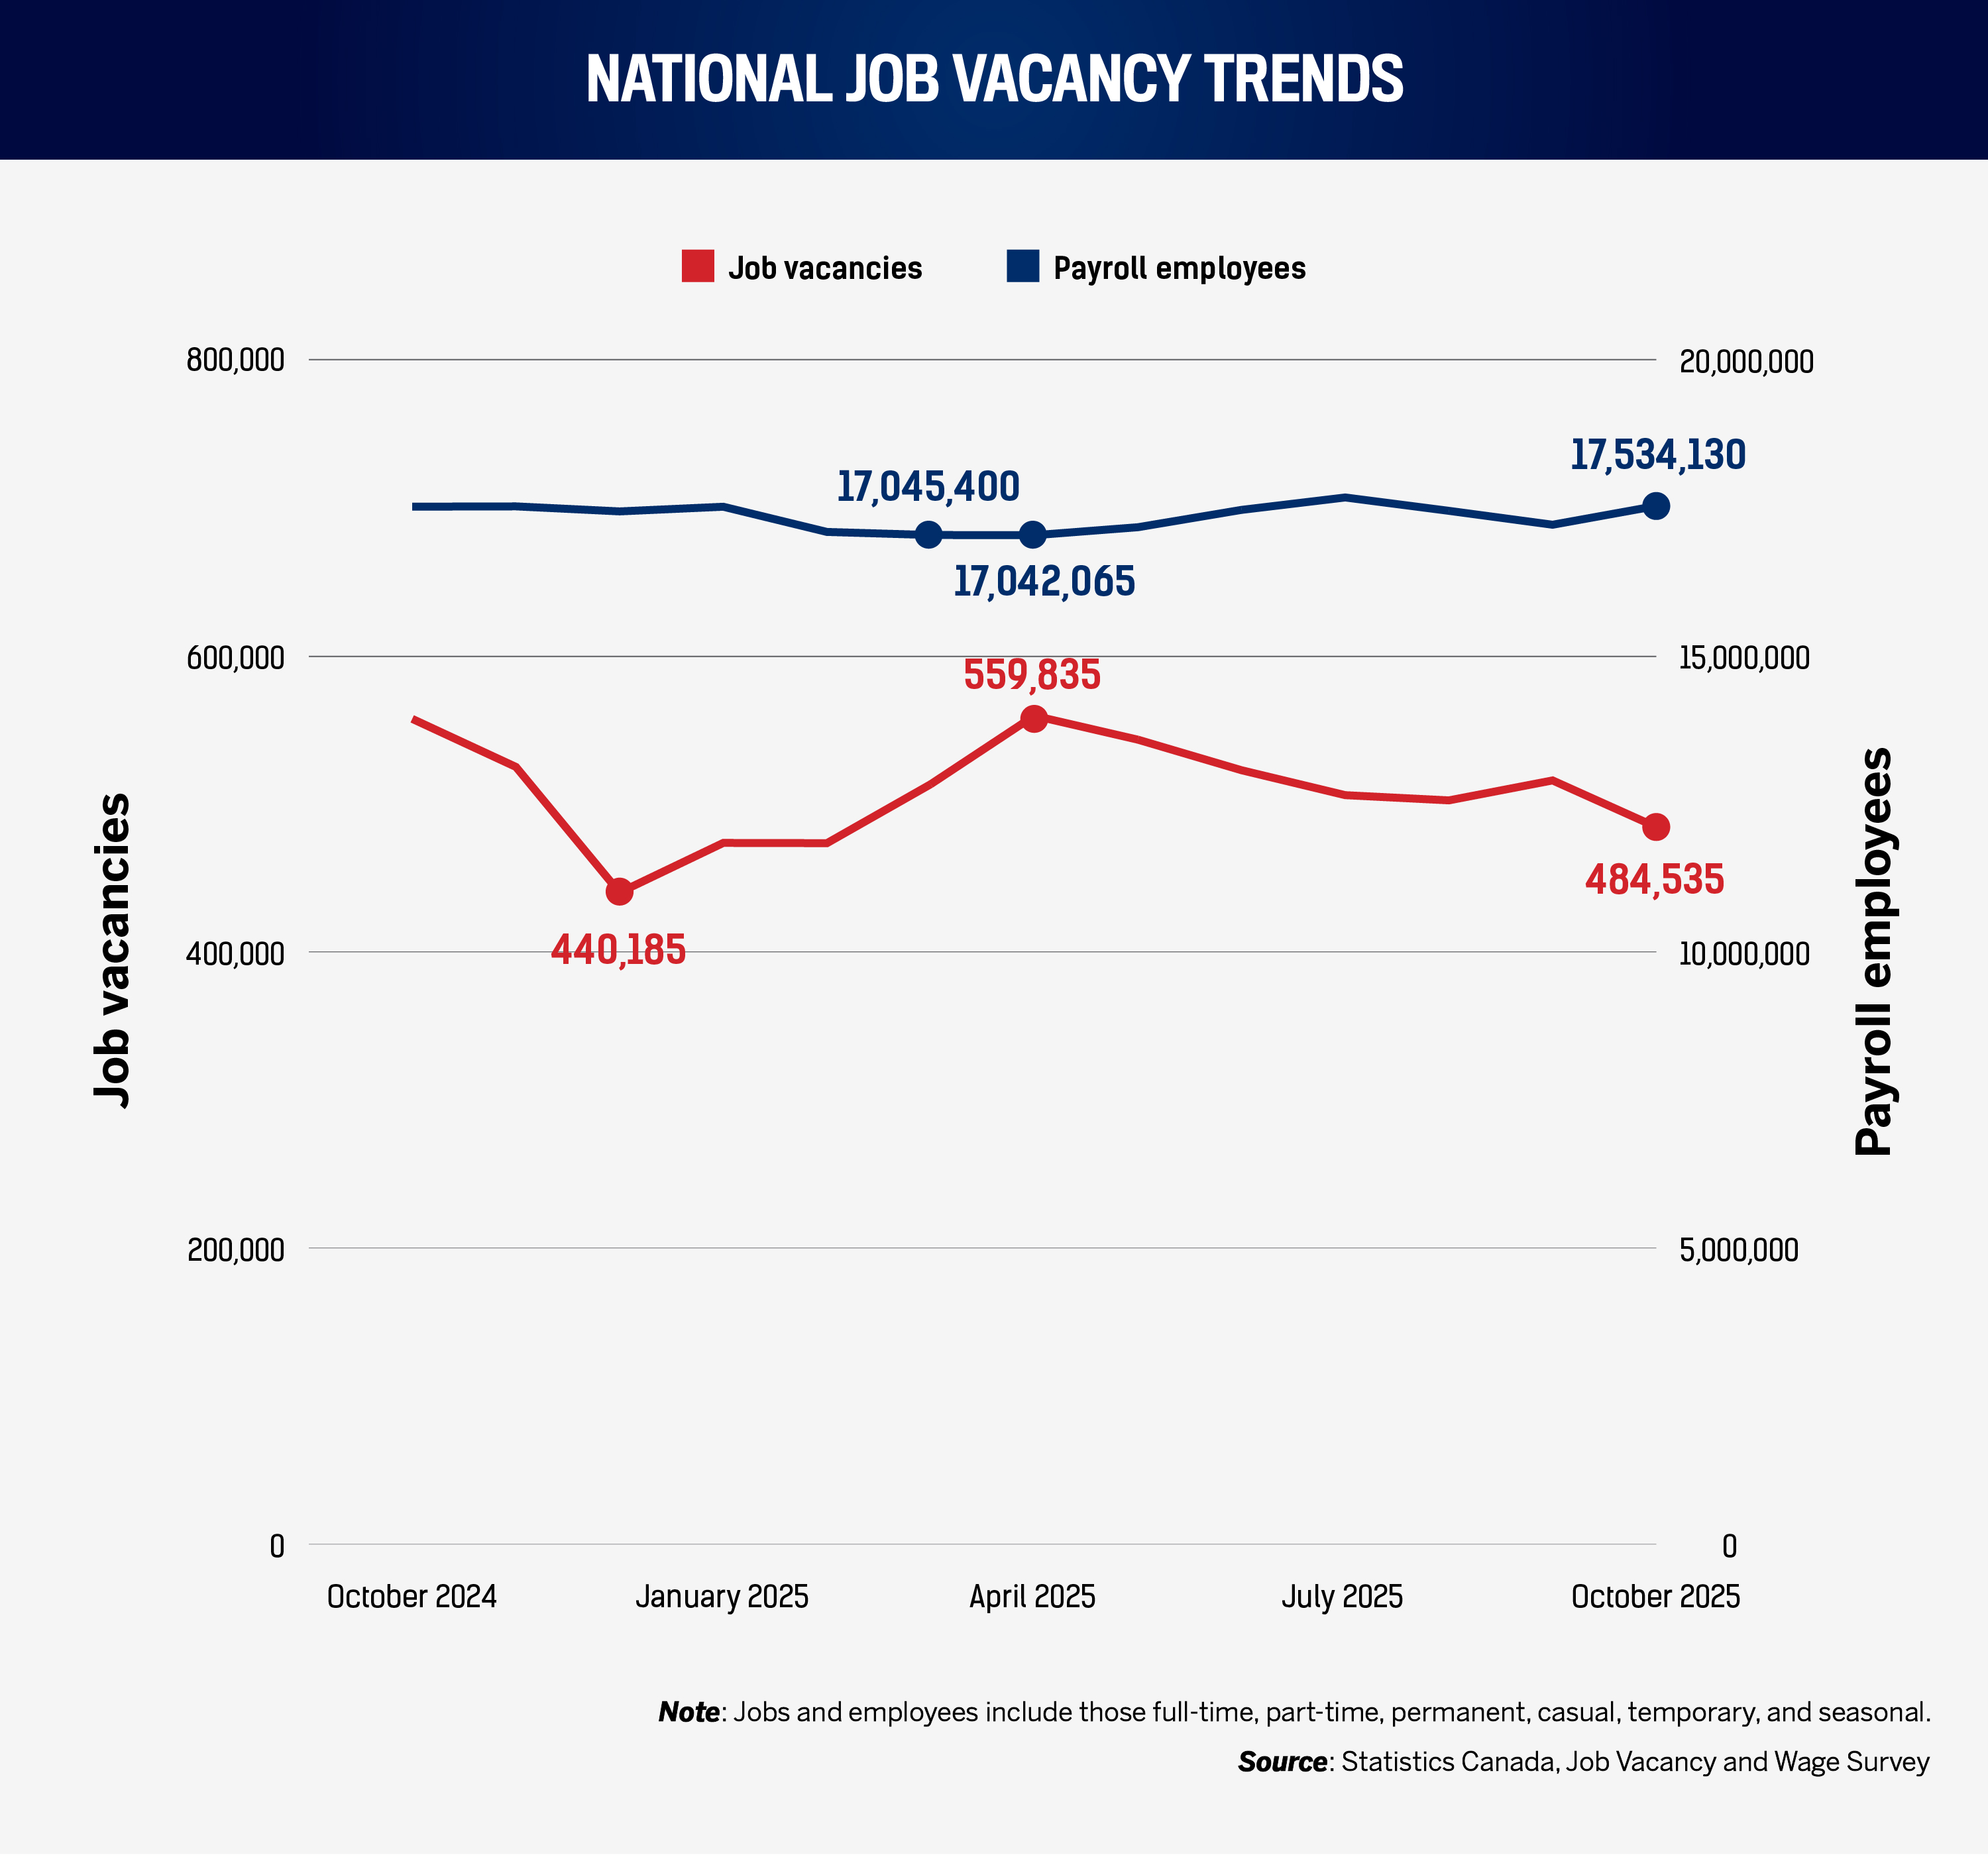
Job vacancies declined from 557,710 in October 2024 to 484,535 in October 2025, a 13.1 percent year-over-year (YoY) drop to their lowest level since the previous February, and a clear sign of cooling labour demand, also highlighted in November’s edition. The number of employees was essentially flat over the year, edging from 17.52 million to 17.53 million (up 0.1 percent). Fewer posted jobs, with broadly stable employment, have shifted modest bargaining power back toward employers.
HR implication: Hiring urgency has eased. This is a cue to separate “hiring capacity” from “hiring intent.” You may be onboarding effectively, but the organization is choosing to carry fewer open jobs at any one time, reducing visible demand without necessarily reducing staff.
Last month’s Strategic HR framed a 2.7 percent vacancy rate and roughly 482,500 openings as a return to “post-pandemic normal.” October 2025 data reinforce this shift, sharpening the implication for managers: advantage will come less from bidding wars and more from disciplined, defensible pay and hiring decisions.
1.B. Industry-specific vacancies
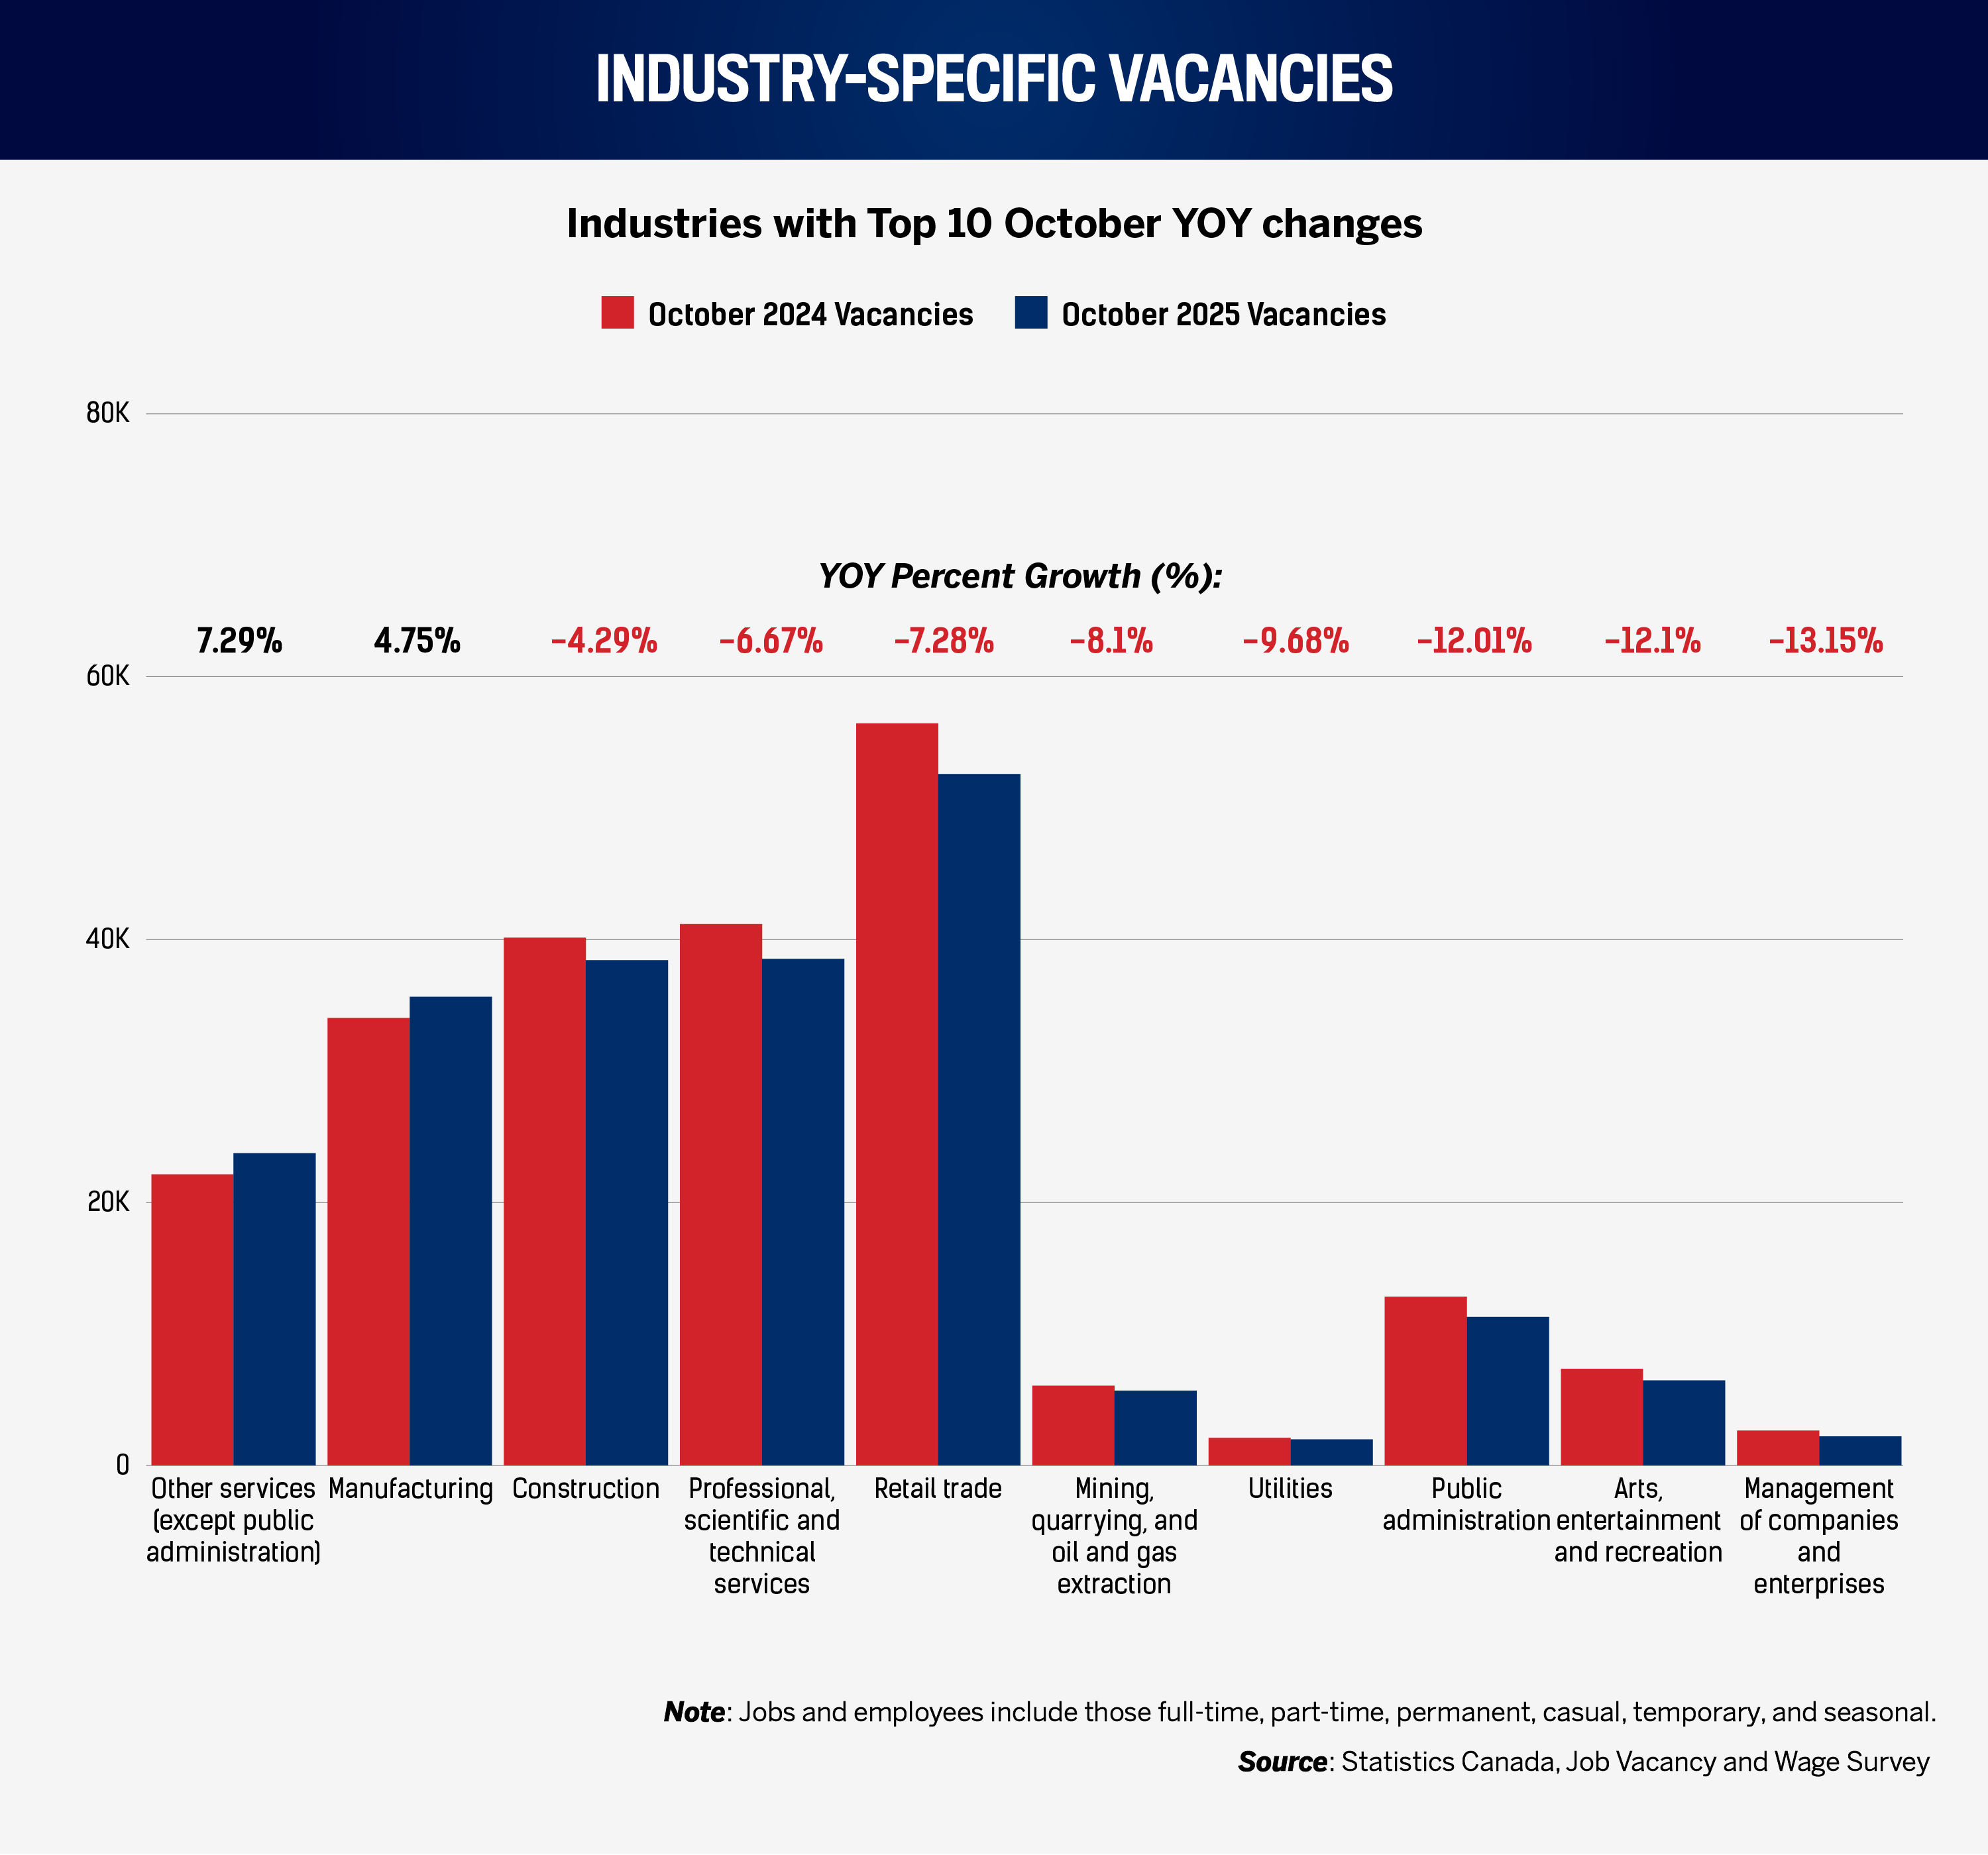
Among the 10 industries with the strongest YoY vacancy performance, only two saw actual growth in October: “other services” (excluding public administration), up 7.3 percent, and manufacturing, up 4.8 percent (a notable industry given recent US trade shocks and Canadian infrastructure investment for Canadian businesses). The remaining industries posted declines consistent with prior months, though many fell less sharply than before.
Several large-employer categories – construction, professional services, and retail – remain near the top of October’s YoY table, although with negative vacancy growth. Information and cultural industries, which had been a mainstay of YoY vacancy growth for months, have swung to a 24 percent decline in job openings compared with a year earlier.
For HR leaders, the picture is nuanced. In construction and professional services, the easier market is likely to be at entry- and mid-level generalist roles (see “Unemployment”); experienced specialists, regulated professionals, and leaders of compliance-heavy functions are still likely to be scarce.
This month, the manufacturing sector shows rising vacancies but moderate wage growth (about 3.2 percent, below top-performing industries; see Section 2.B). That combination often foreshadows pinch points in specific roles: the sector is hiring, but pay is not keeping pace with the most competitive markets.
Broadly, vacancy trends support continued budget prioritization. In industries where vacancies remain relatively high, HR should preserve sourcing capacity and focus on shortening time to fill for critical roles. Where vacancies have fallen sharply (read “information and culture industries”), requisition approvals should tighten, and business cases should be revalidated.
2. Wages
2.A. Wages vs. inflation
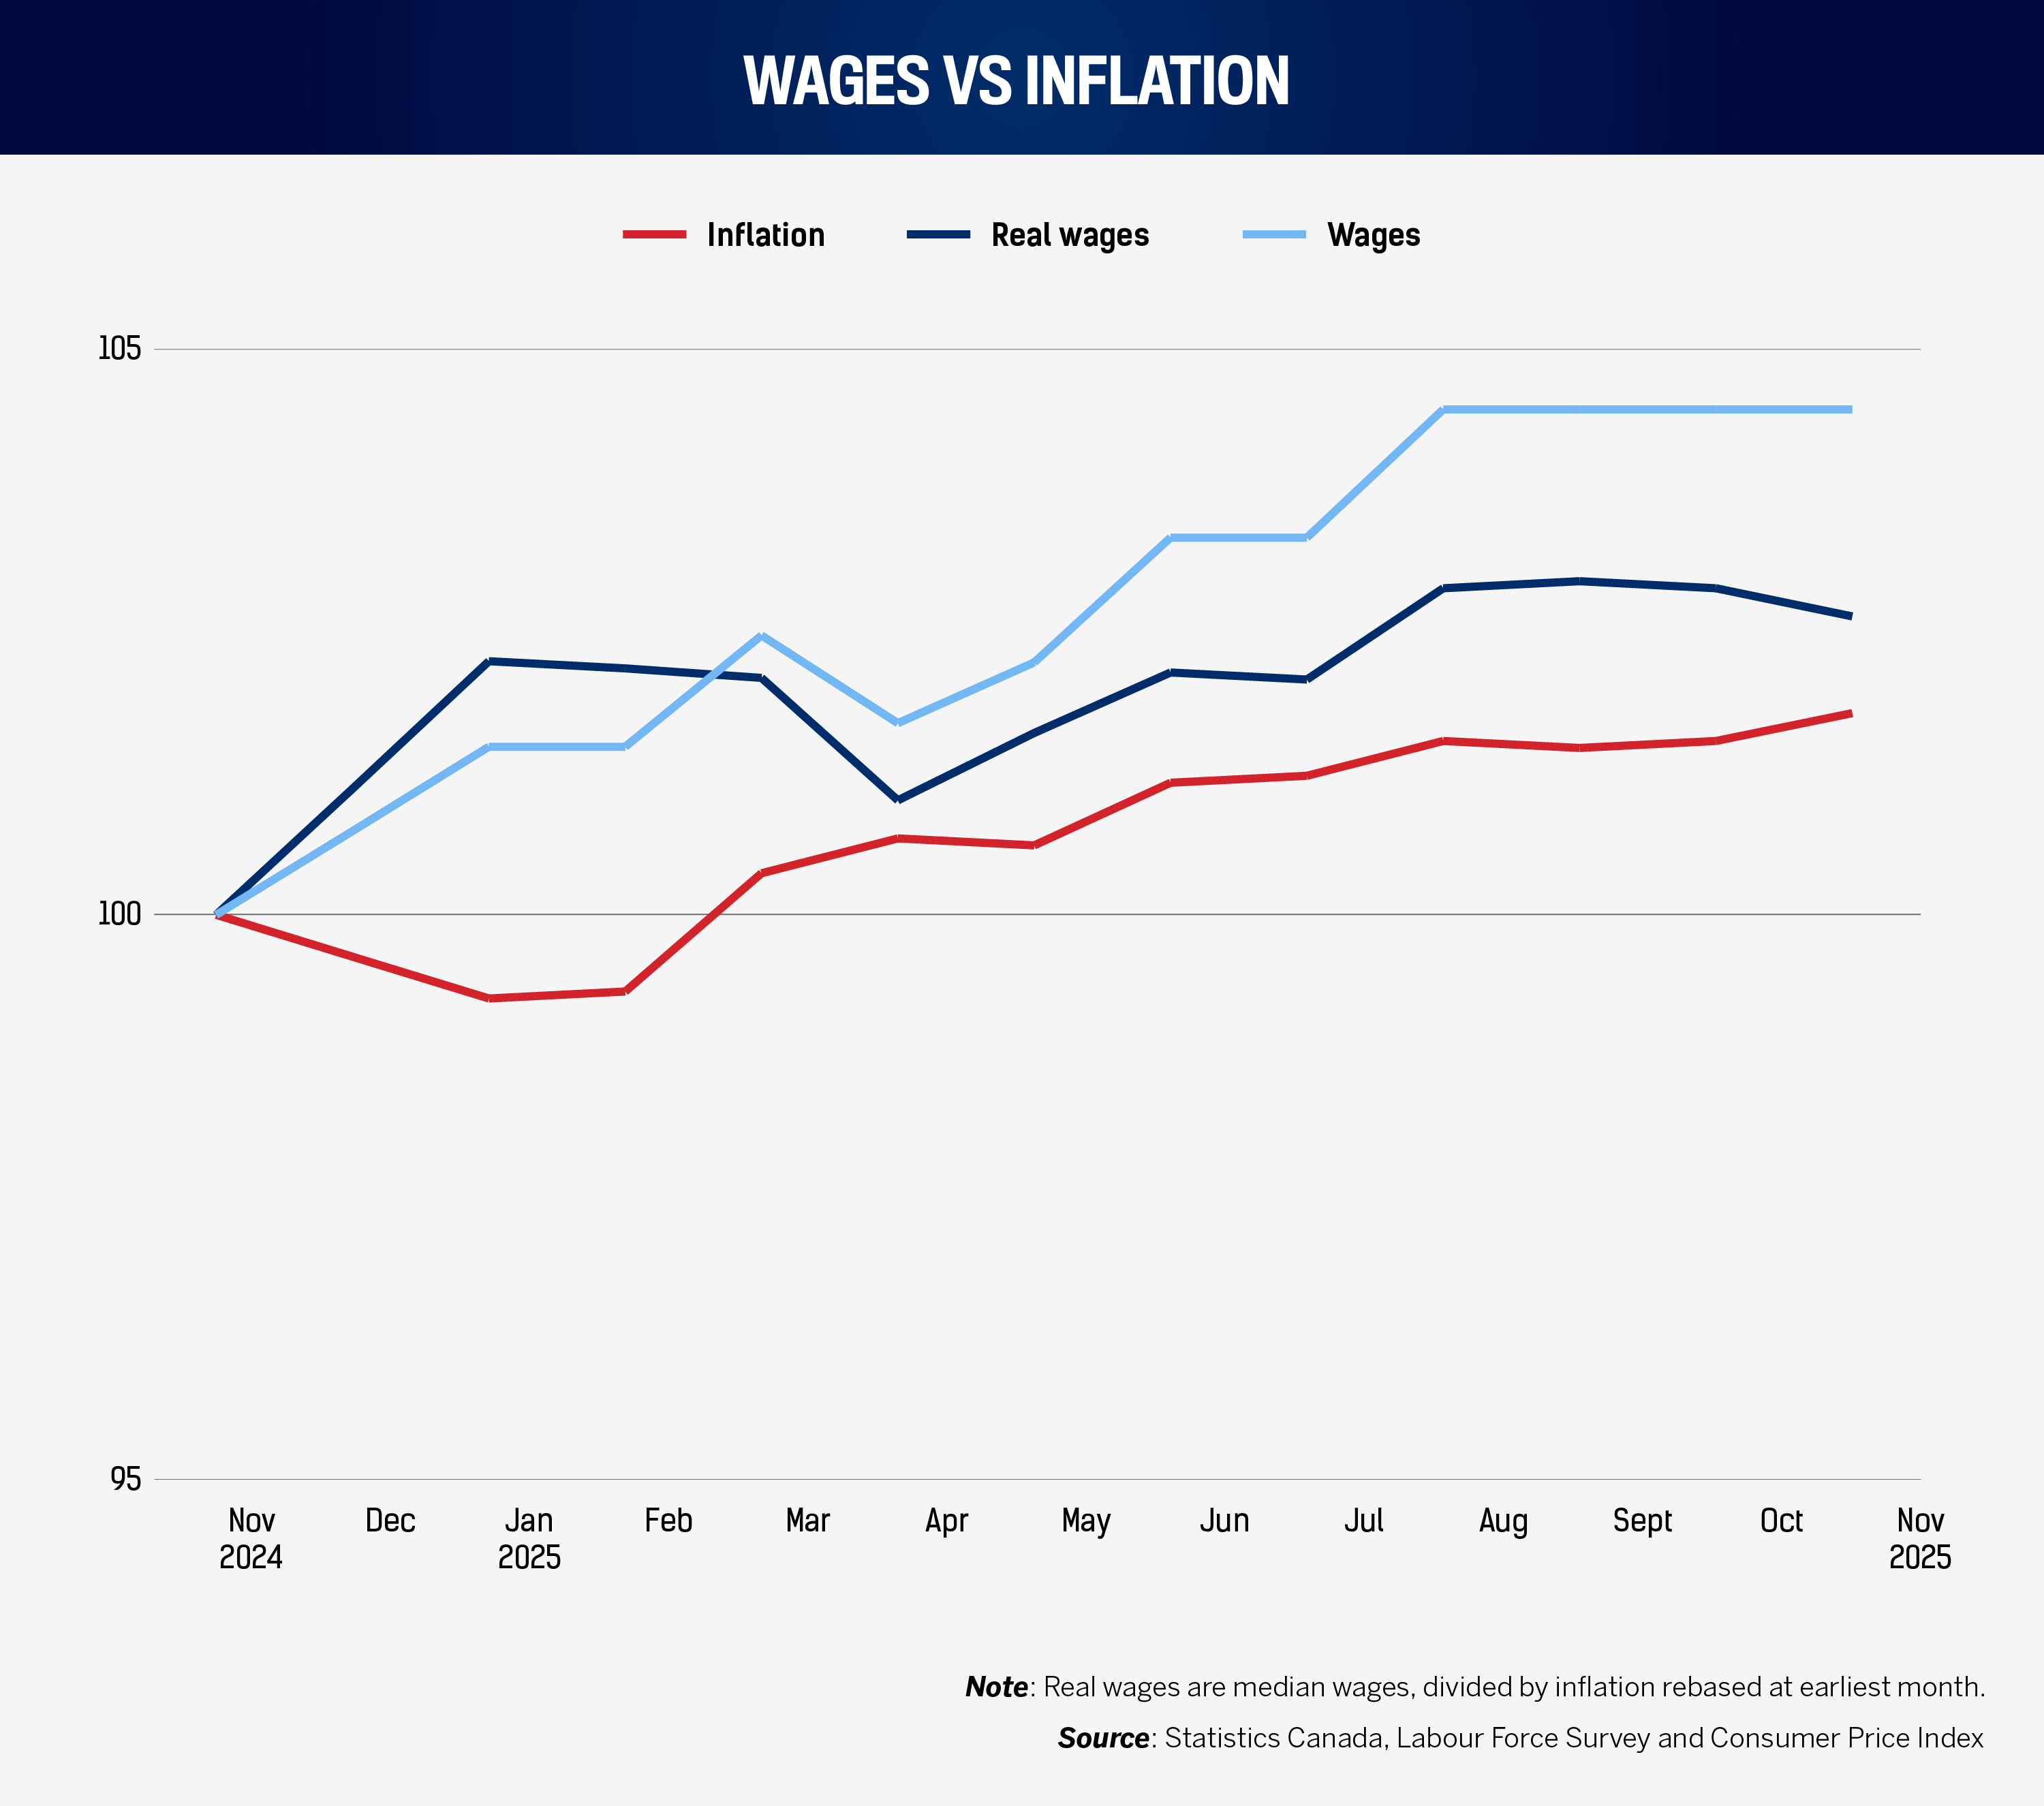
Median hourly wages rose from $33.75 in November 2024 to $35.00 in November 2025, an increase of $1.25, or 3.7 percent. Over the same period, the consumer price index (2002 = 100) climbed from 161.8 to 165.4, a 2.2 percent gain. Nominal pay growth, in other words, exceeded inflation.
When adjusted for inflation, the implied real median wage rose by about $0.64, or 1.9 percent, over the year: modest, but positive. Median wages themselves have been flat at $35 since July, so future real-wage gains for now depend entirely on whether inflation remains subdued.
In the previous edition, covering October 2024 to October 2025, nominal pay was already outpacing inflation, producing similar real-wage gains. That pattern continues: it is weak inflation, more than robust wage setting, that is improving employees’ paycheques.
HR takeaway: In a labour market where vacancies have cooled but real wages are inching higher, retention strategy should lean less on one-off counteroffers and more on predictable progression, benefits clarity, and transparent pay decisions. With labour supply rising and openings declining, it may be tempting to assume pay pressure will simply fade. Yet sector data suggest that in several skill-constrained industries, wage growth remains strong and competition for talent remains intense.
2.B. Industry-specific median wage change
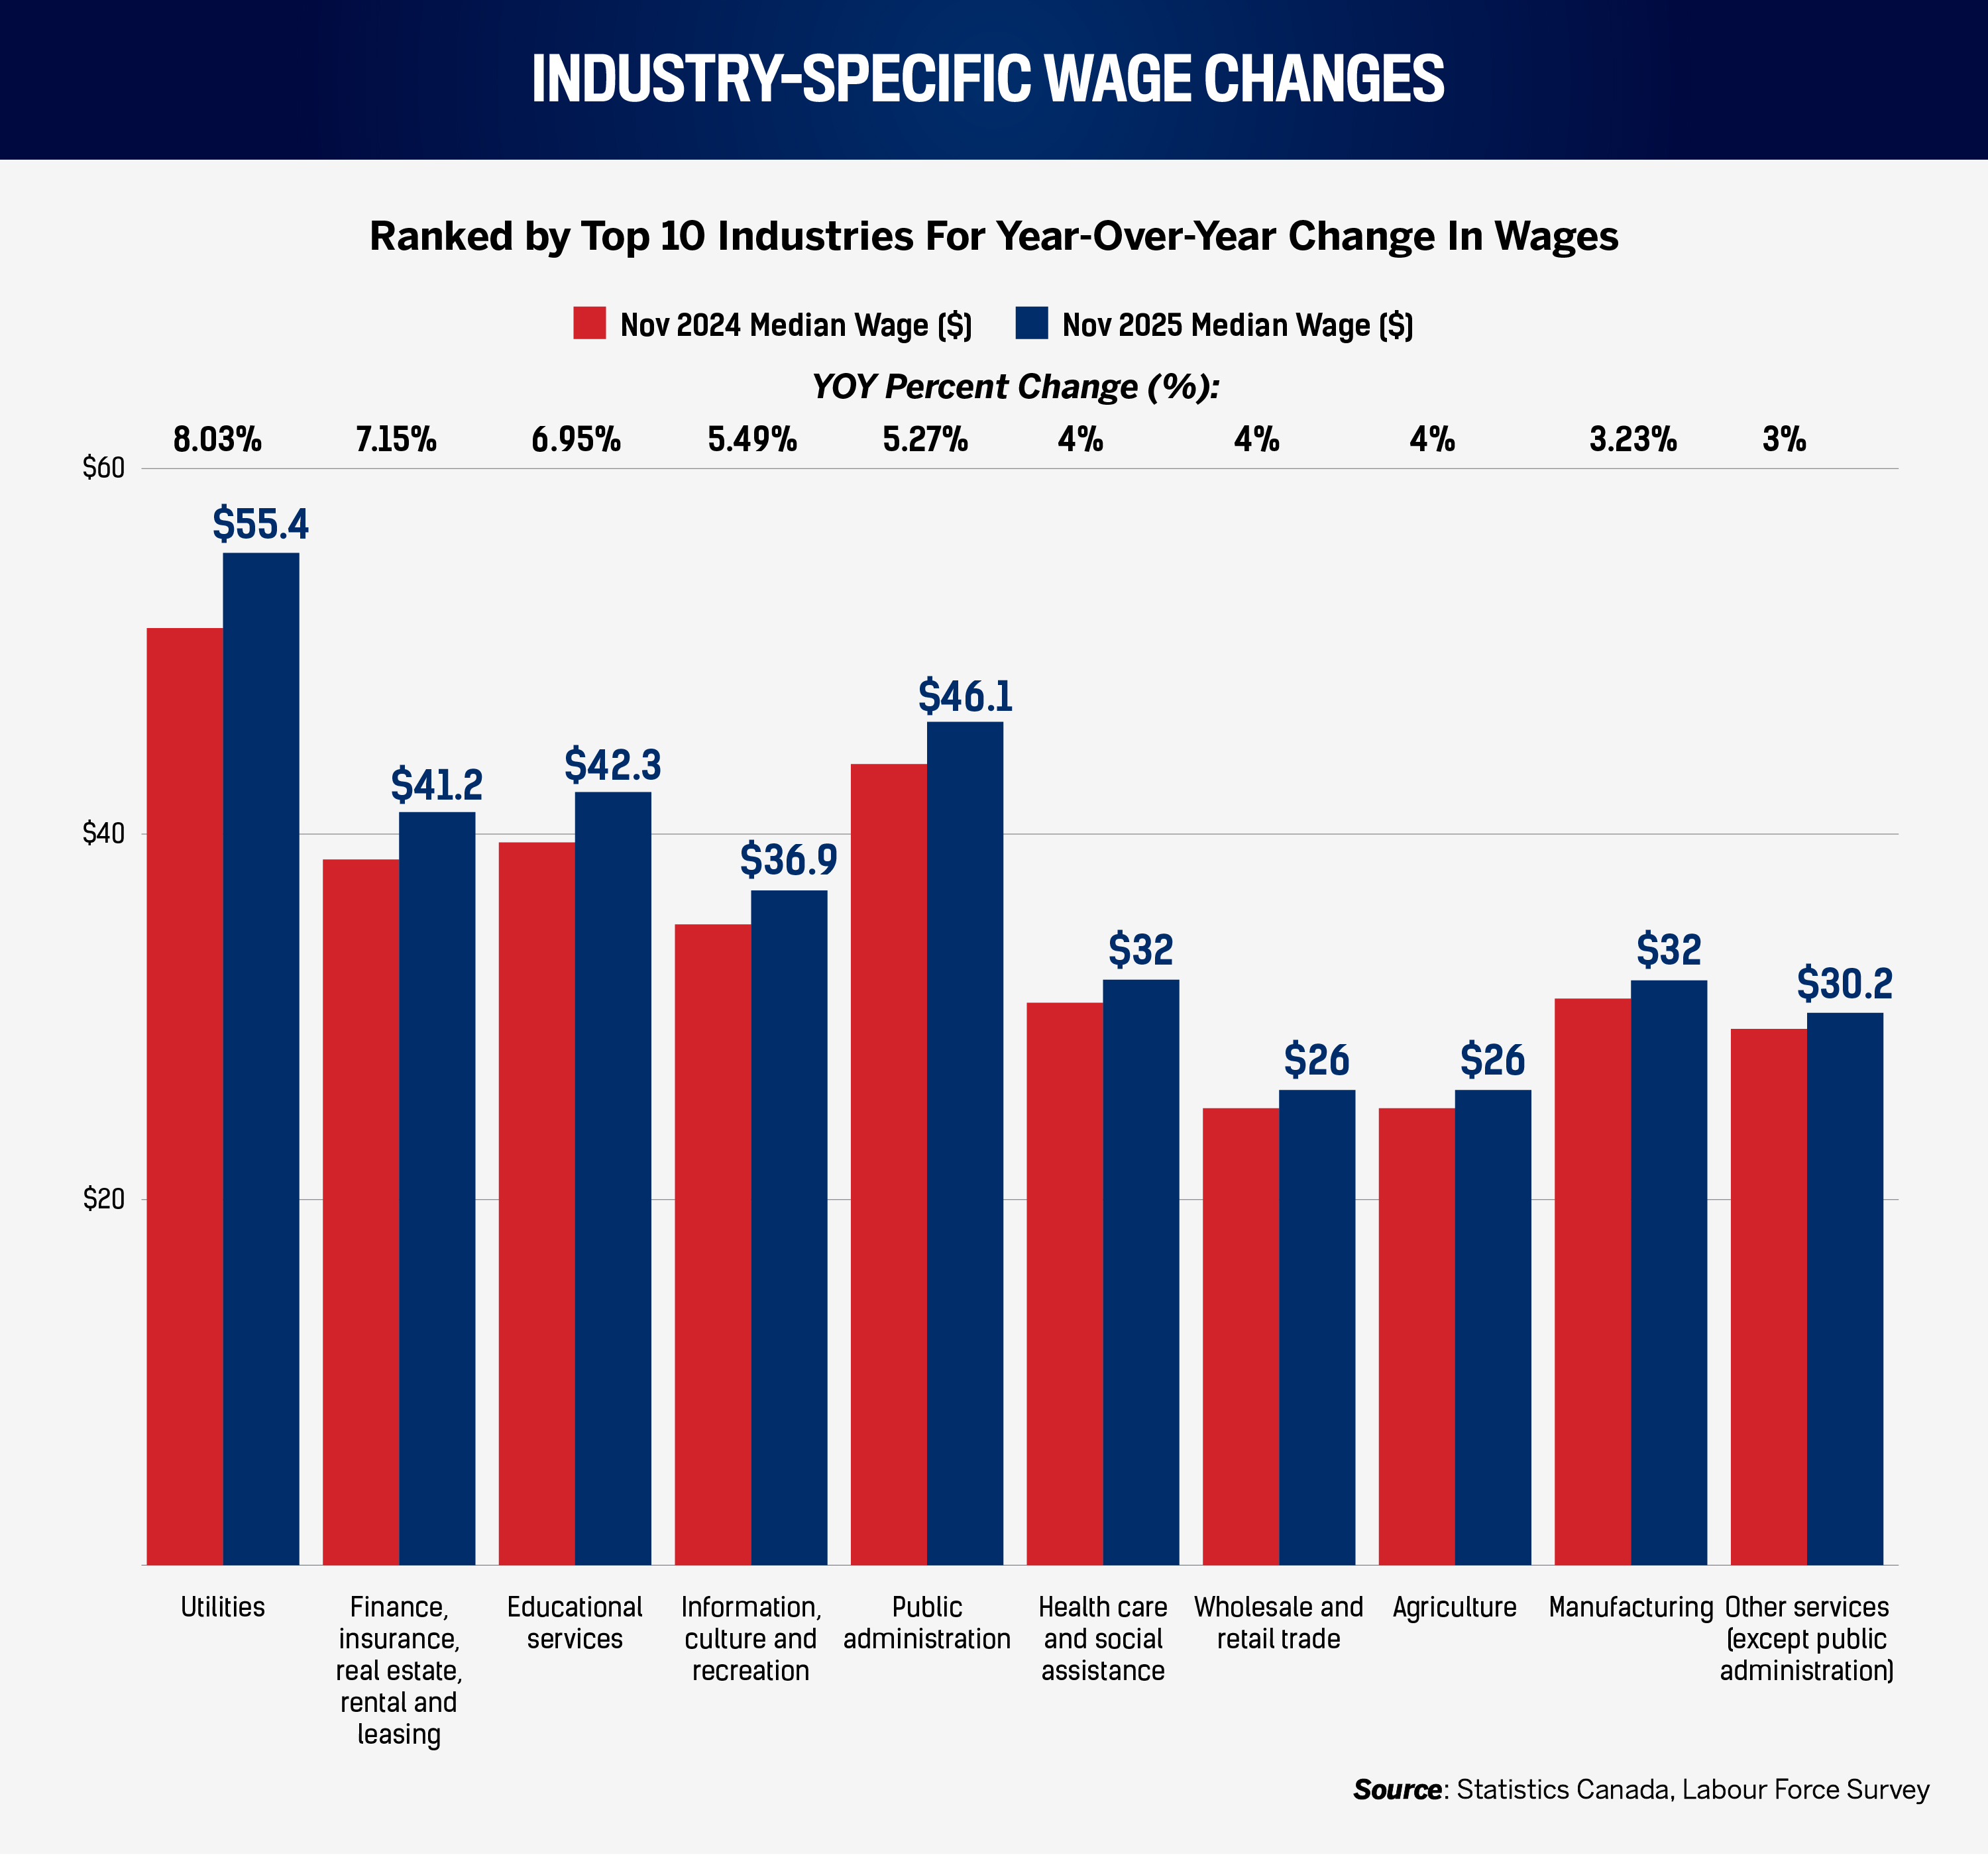
From November 2024 to November 2025, utilities recorded the largest increase in median hourly pay, rising from $51.28 to $55.40, an 8.0 percent jump and the strongest industry gain for the second consecutive month. In a sector defined by safety-critical work, credential requirements, and long skill-development timelines, that is a meaningful shift. Employers who compete with utilities for electricians, engineers, or safety specialists should take notice.
Finance, insurance, real estate, rental, and leasing saw median wages climb from $38.46 to $41.21, a 7.2 percent increase. National vacancy retractions may give managers the impression that recruiting in these fields should be easier. The wage data suggest otherwise: the market is still paying up, and constraints are more about the quality than the quantity of applicants.
Educational services posted a 7.0 percent median wage gain, and public administration 5.3 percent, continuing a run of public-sector wage momentum. That matters for private employers whose talent pools overlap. Public-sector pay drift sets a reference point not only for wages but also for stability, benefits, and perceived fairness. Where private employers cannot match pensions or job security, they will need to compete through role design, flexibility, and advancement opportunities. This point is underscored by tenure trends in service and knowledge sectors (see Section 3).
Information, culture, and recreation is notable for a different reason. Wages there rose 5.5 percent, yet the sector also recorded the month’s steepest tenure decline (Section 3). When employers pay more but still cannot hold on to people, pay is rarely the main problem. Work design, scheduling, career structure, and management quality tend to be the real levers.
At the lower end, manufacturing’s median wages rose 3.2 percent, even as vacancies increased (Section 1.B). That is a classic early sign of role-level shortages: the number of openings is up, but median pay is not rising as fast as in other sectors. HR teams in manufacturing should anticipate targeted premiums – for hard-to-fill trades, less desirable shifts, or retention-critical roles – rather than broad-based increases.
2.C. Industry-specific gender wage gap
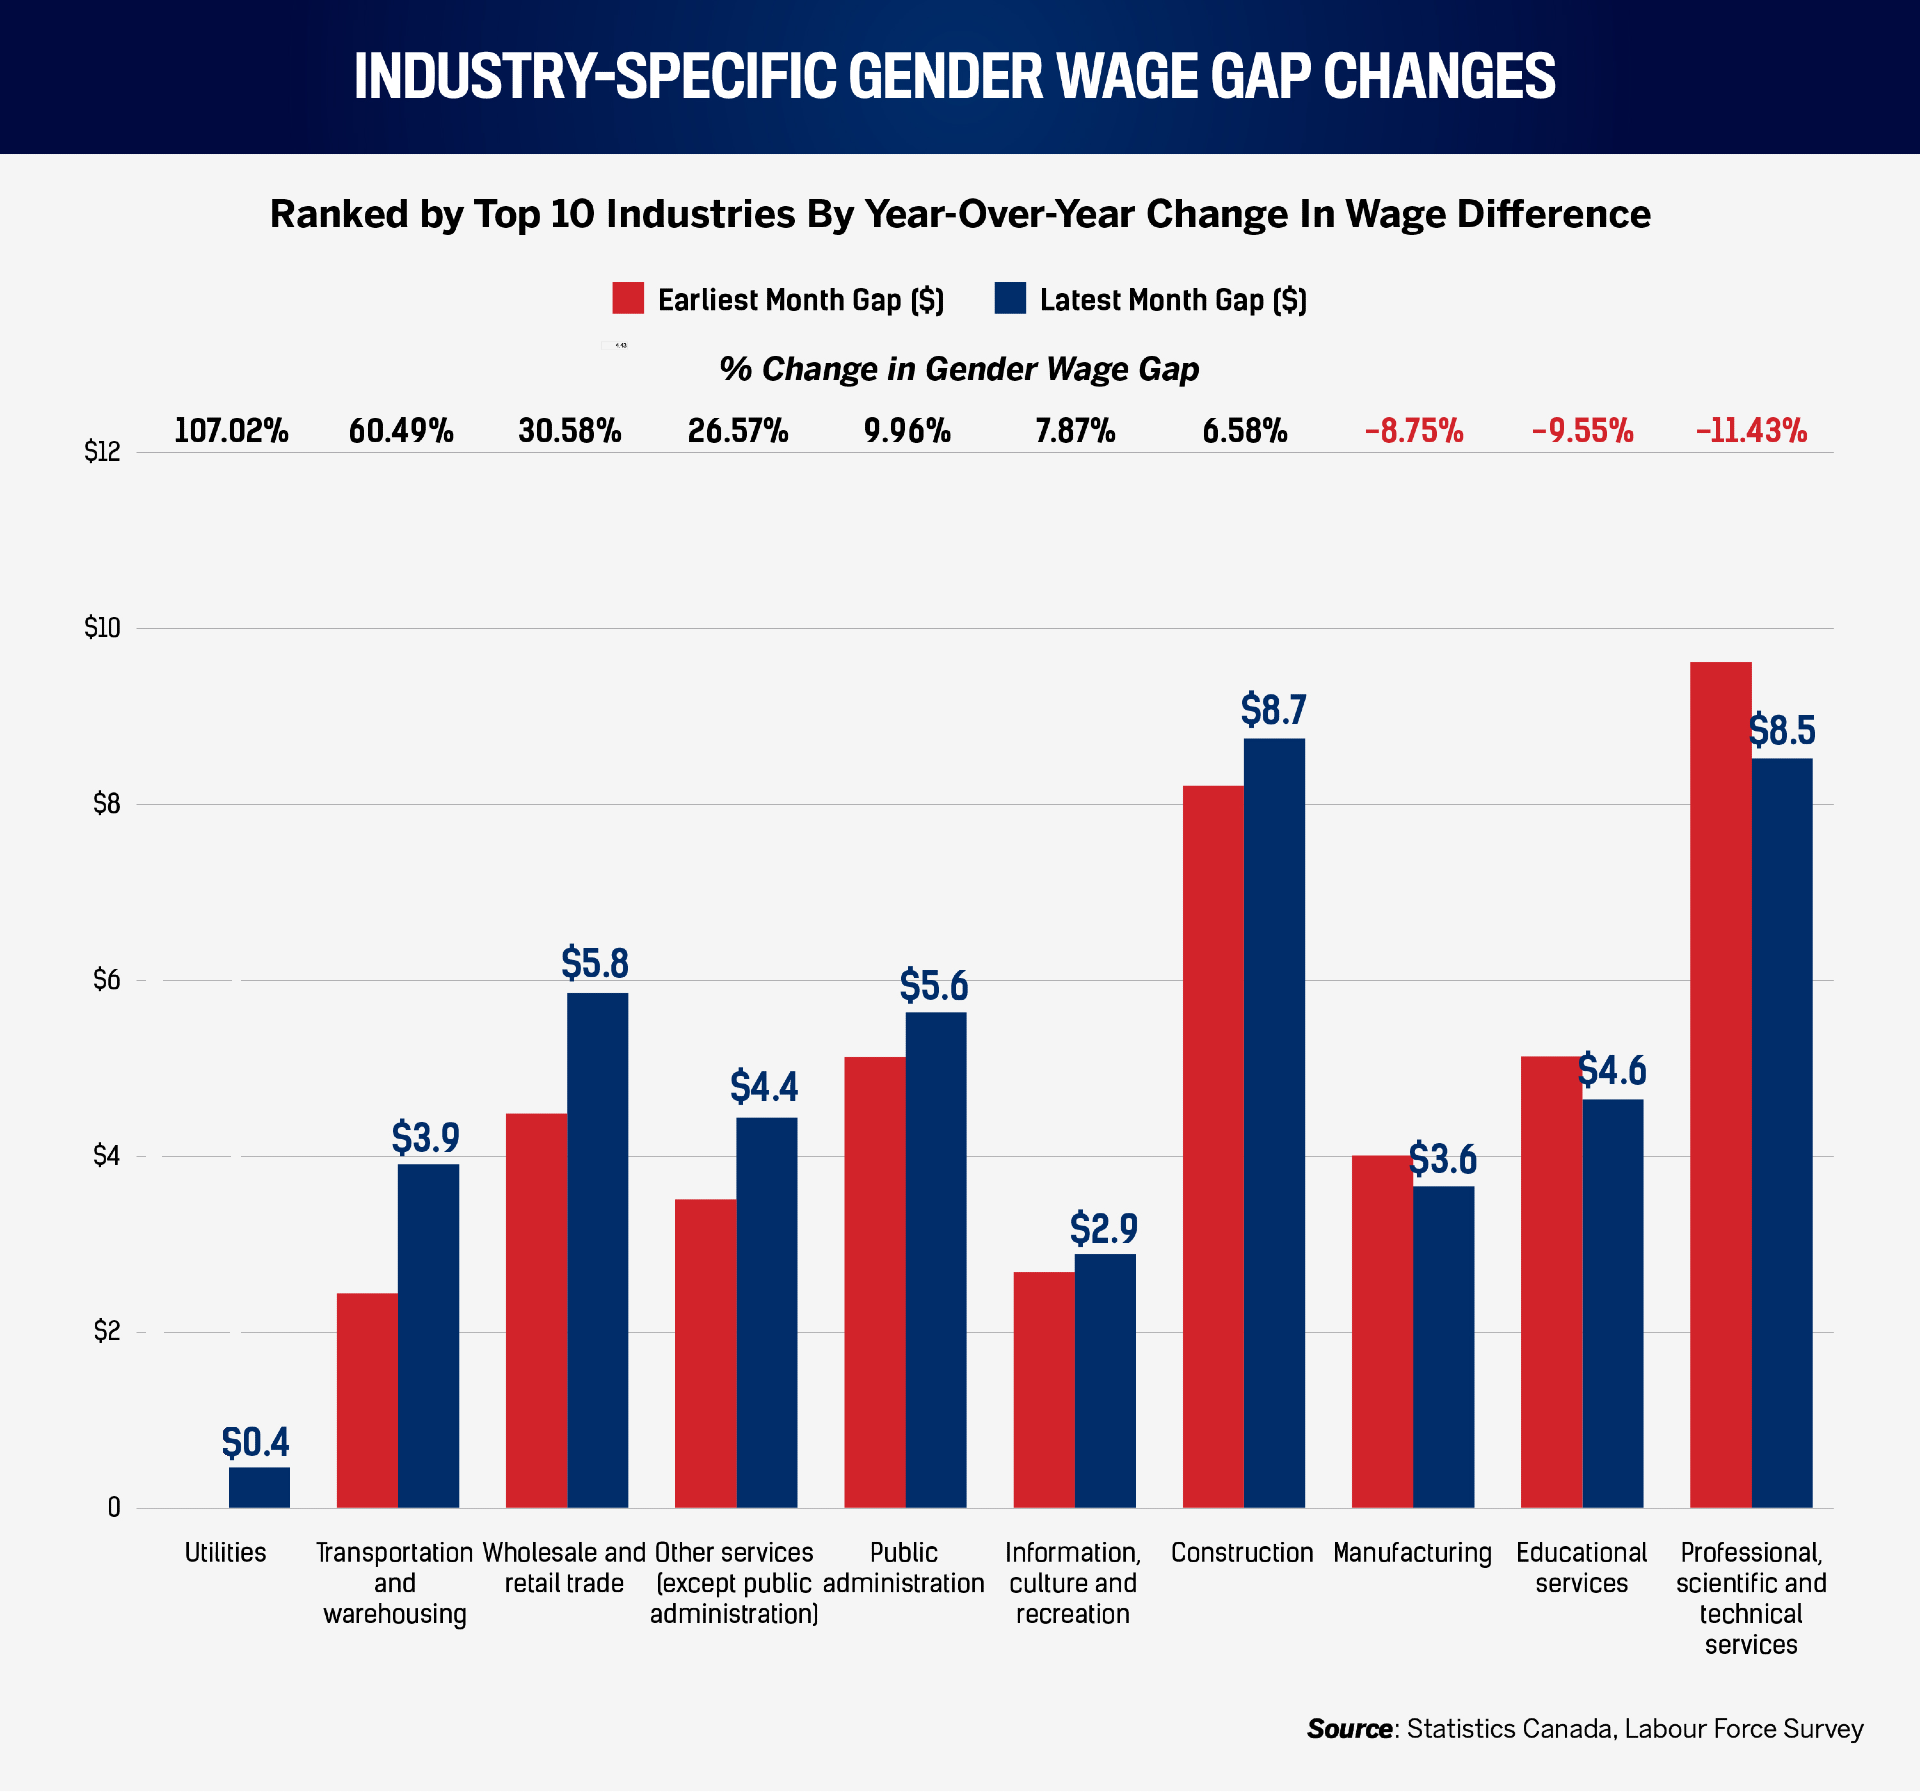
In November, seven industries showed a widening gender wage gap compared with a year earlier; many others either narrowed or improved.
The most dramatic movement this month was in utilities, where the gap shifted from -6.41 to 0.45 on the series’ measure, producing the largest percentage change. Utilities are already wage leaders (Section 2.B). When strong pay growth coincides with a worsening gender gap, the reputational and employee-relations stakes tend to be higher.
Transportation and warehousing and wholesale and retail trade, both large employers, also posted significant widening – 60.5 percent and 30.6 percent, respectively, on the series’ percentage-change measure. In such sectors, gender gaps often grow not primarily from base-pay decisions, but from differences in access to overtime, assignment to higher-paying shifts or equipment, and progression into better-paid roles. Effective remediation usually requires linking workforce analytics to rostering, performance management, and job assignment, not just salary reviews.
“Other services” also recorded a notable widening (+26.6 percent). This sector matters, especially this month, because it overlaps with the only major vacancy-growth leader (Section 1.B). When vacancies rise and pay gaps widen simultaneously, the narrative for employees can be straightforward: the labour market is active, employers are hiring, but fairness is slipping. That is a familiar path from internal discontent to formal complaints.
3. Tenure and litigation
3.A. Average months of tenure by industry
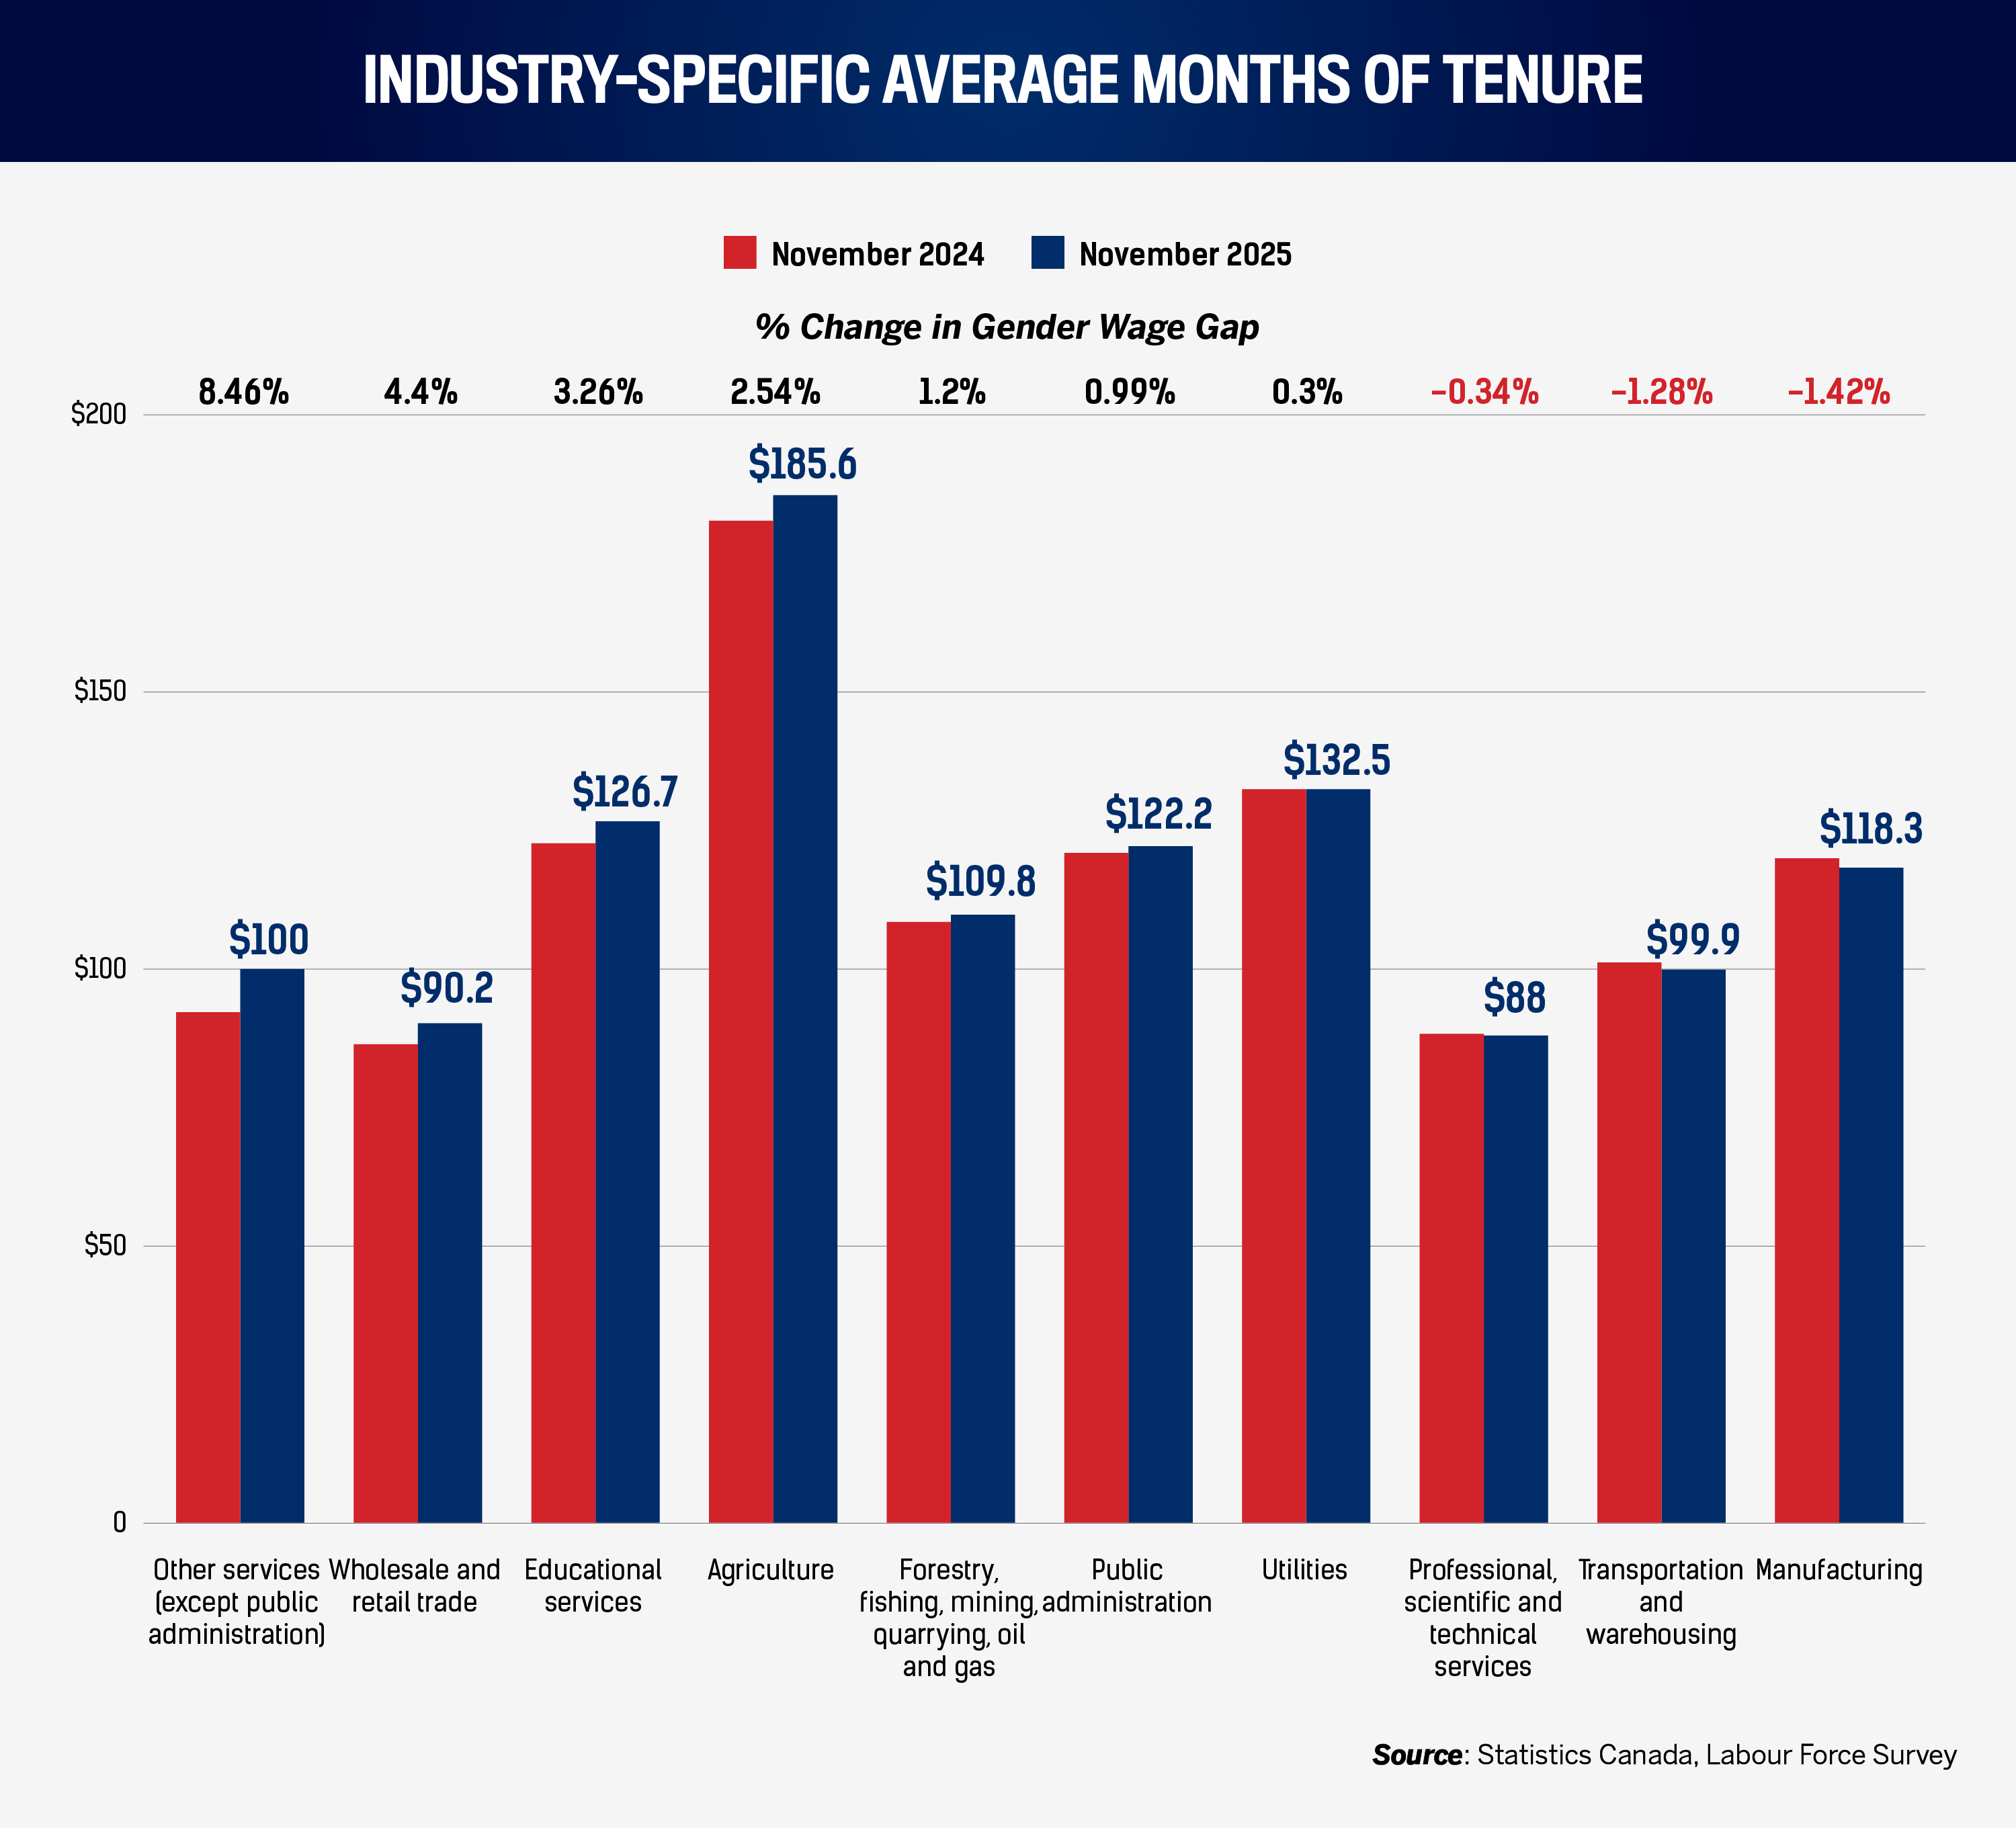
Tenure erosion is now concentrated in some of the very sectors where leaders often assume they can compensate with brand, flexibility, or “interesting work.”
Information, culture, and recreation stands out. Average tenure there fell from 103.4 months to 91.5 months, an 11.5 percent drop – nearly a year of tenure lost on average. This sits alongside one of the strongest wage growth records in the economy (about 5.5 percent; see Section 2.B). When wages are rising and tenure is falling, compensation is rarely the primary retention lever. More likely culprits include project instability, thin progression paths, unmet expectations around flexibility, or weak managerial capability. HR leaders should treat this as a work-design challenge, not a pay issue.
Accommodation and food services show a more familiar pattern, but one that still matters strategically. Tenure slipped from 56.7 to 53.5 months, a 5.6 percent decline. Employers that mistake easing vacancies for a license to reduce retention investment are likely to discover that tenure data tell a more cautionary story.
Perhaps more surprising are tenure declines in sectors not typically associated with high churn. Finance, insurance, real estate, rental, and leasing saw average tenure fall from 111.9 to 106.9 months (down 4.5 percent). Business, building, and other support services declined about 4.0 percent. These are fields in which replacement costs are high and processes are complex, and where weaknesses in documentation, discipline, or performance management can more easily turn into formal disputes.
3.B. Tribunal cases
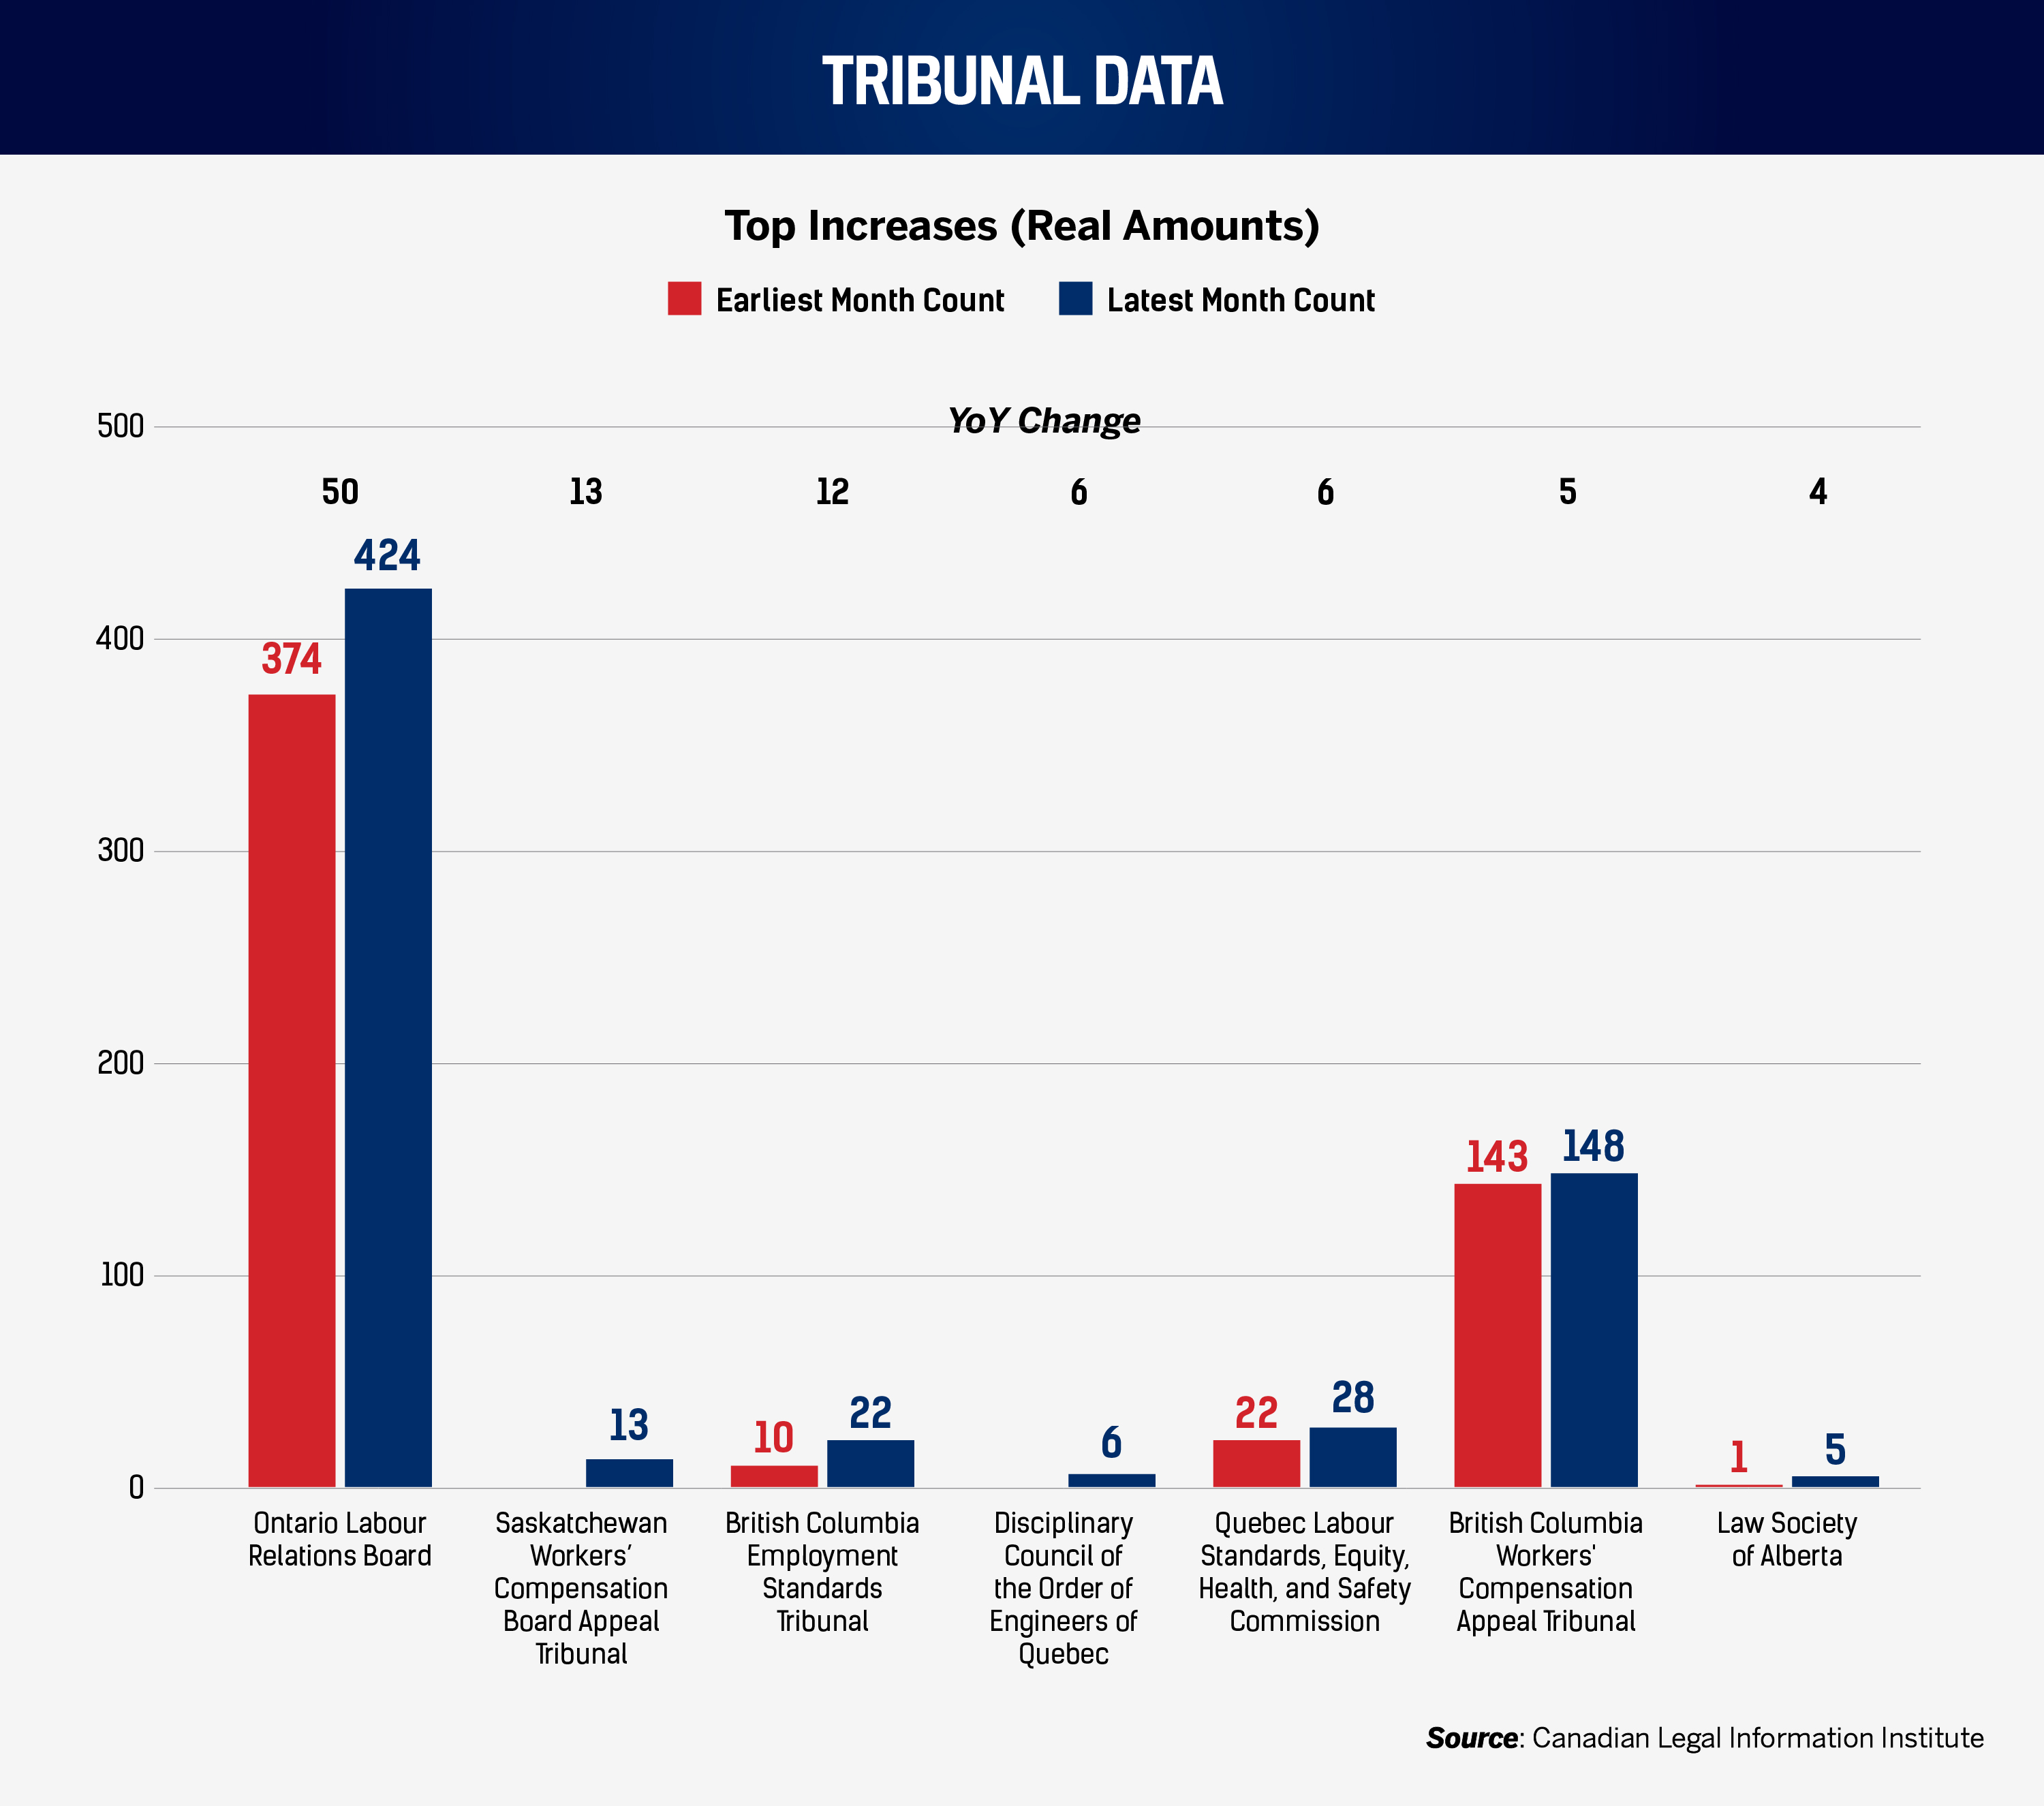
The Ontario Labour Relations Board remains Canada’s busiest labour tribunal in this environment, with its caseload rising by 50 cases YoY, from 374 to 424. Even as vacancies cool and unemployment does not surge, the machinery of labour relations – union engagement, representation disputes, and procedural compliance – continues to generate a significant volume of cases.
A notable share of this month’s OLRB matters is seen to involve administrative and procedural issues: problems with applications and service, address or email errors, disputes over disclosure of internal communications, and withdrawals or other procedural steps. These failures tend to appear when organizations scale quickly, delegate sensitive tasks to unprepared managers, or treat employee relations processes as informal.
In British Columbia’s Employment Standards Tribunal, decisions frequently revolve around wages and deductions, procedural fairness, and evidentiary questions, sometimes in the context of remote or complex workplaces. In Quebec, the Commission des normes, de l’équité, de la santé et de la sécurité du travail is dealing with cases focused on pay equity maintenance and job category evaluation. In professional disciplines, especially for engineers, many matters involve agreed sanctions and technical practice standards, underscoring the distinct compliance risk that accompanies regulated workforces.
At Saskatchewan’s Workers’ Compensation Board Appeal Tribunal, disputes cluster around benefits: wage-loss entitlements, employer appeals, and injury or return-to-work issues.
For HR, the pattern is clear. As tenure falls and pay and progression issues sharpen, procedural rigour around documentation, communication, and compliance becomes not only a legal necessity but also a core risk management tool.
4. Workforce
4.A. National working population trend
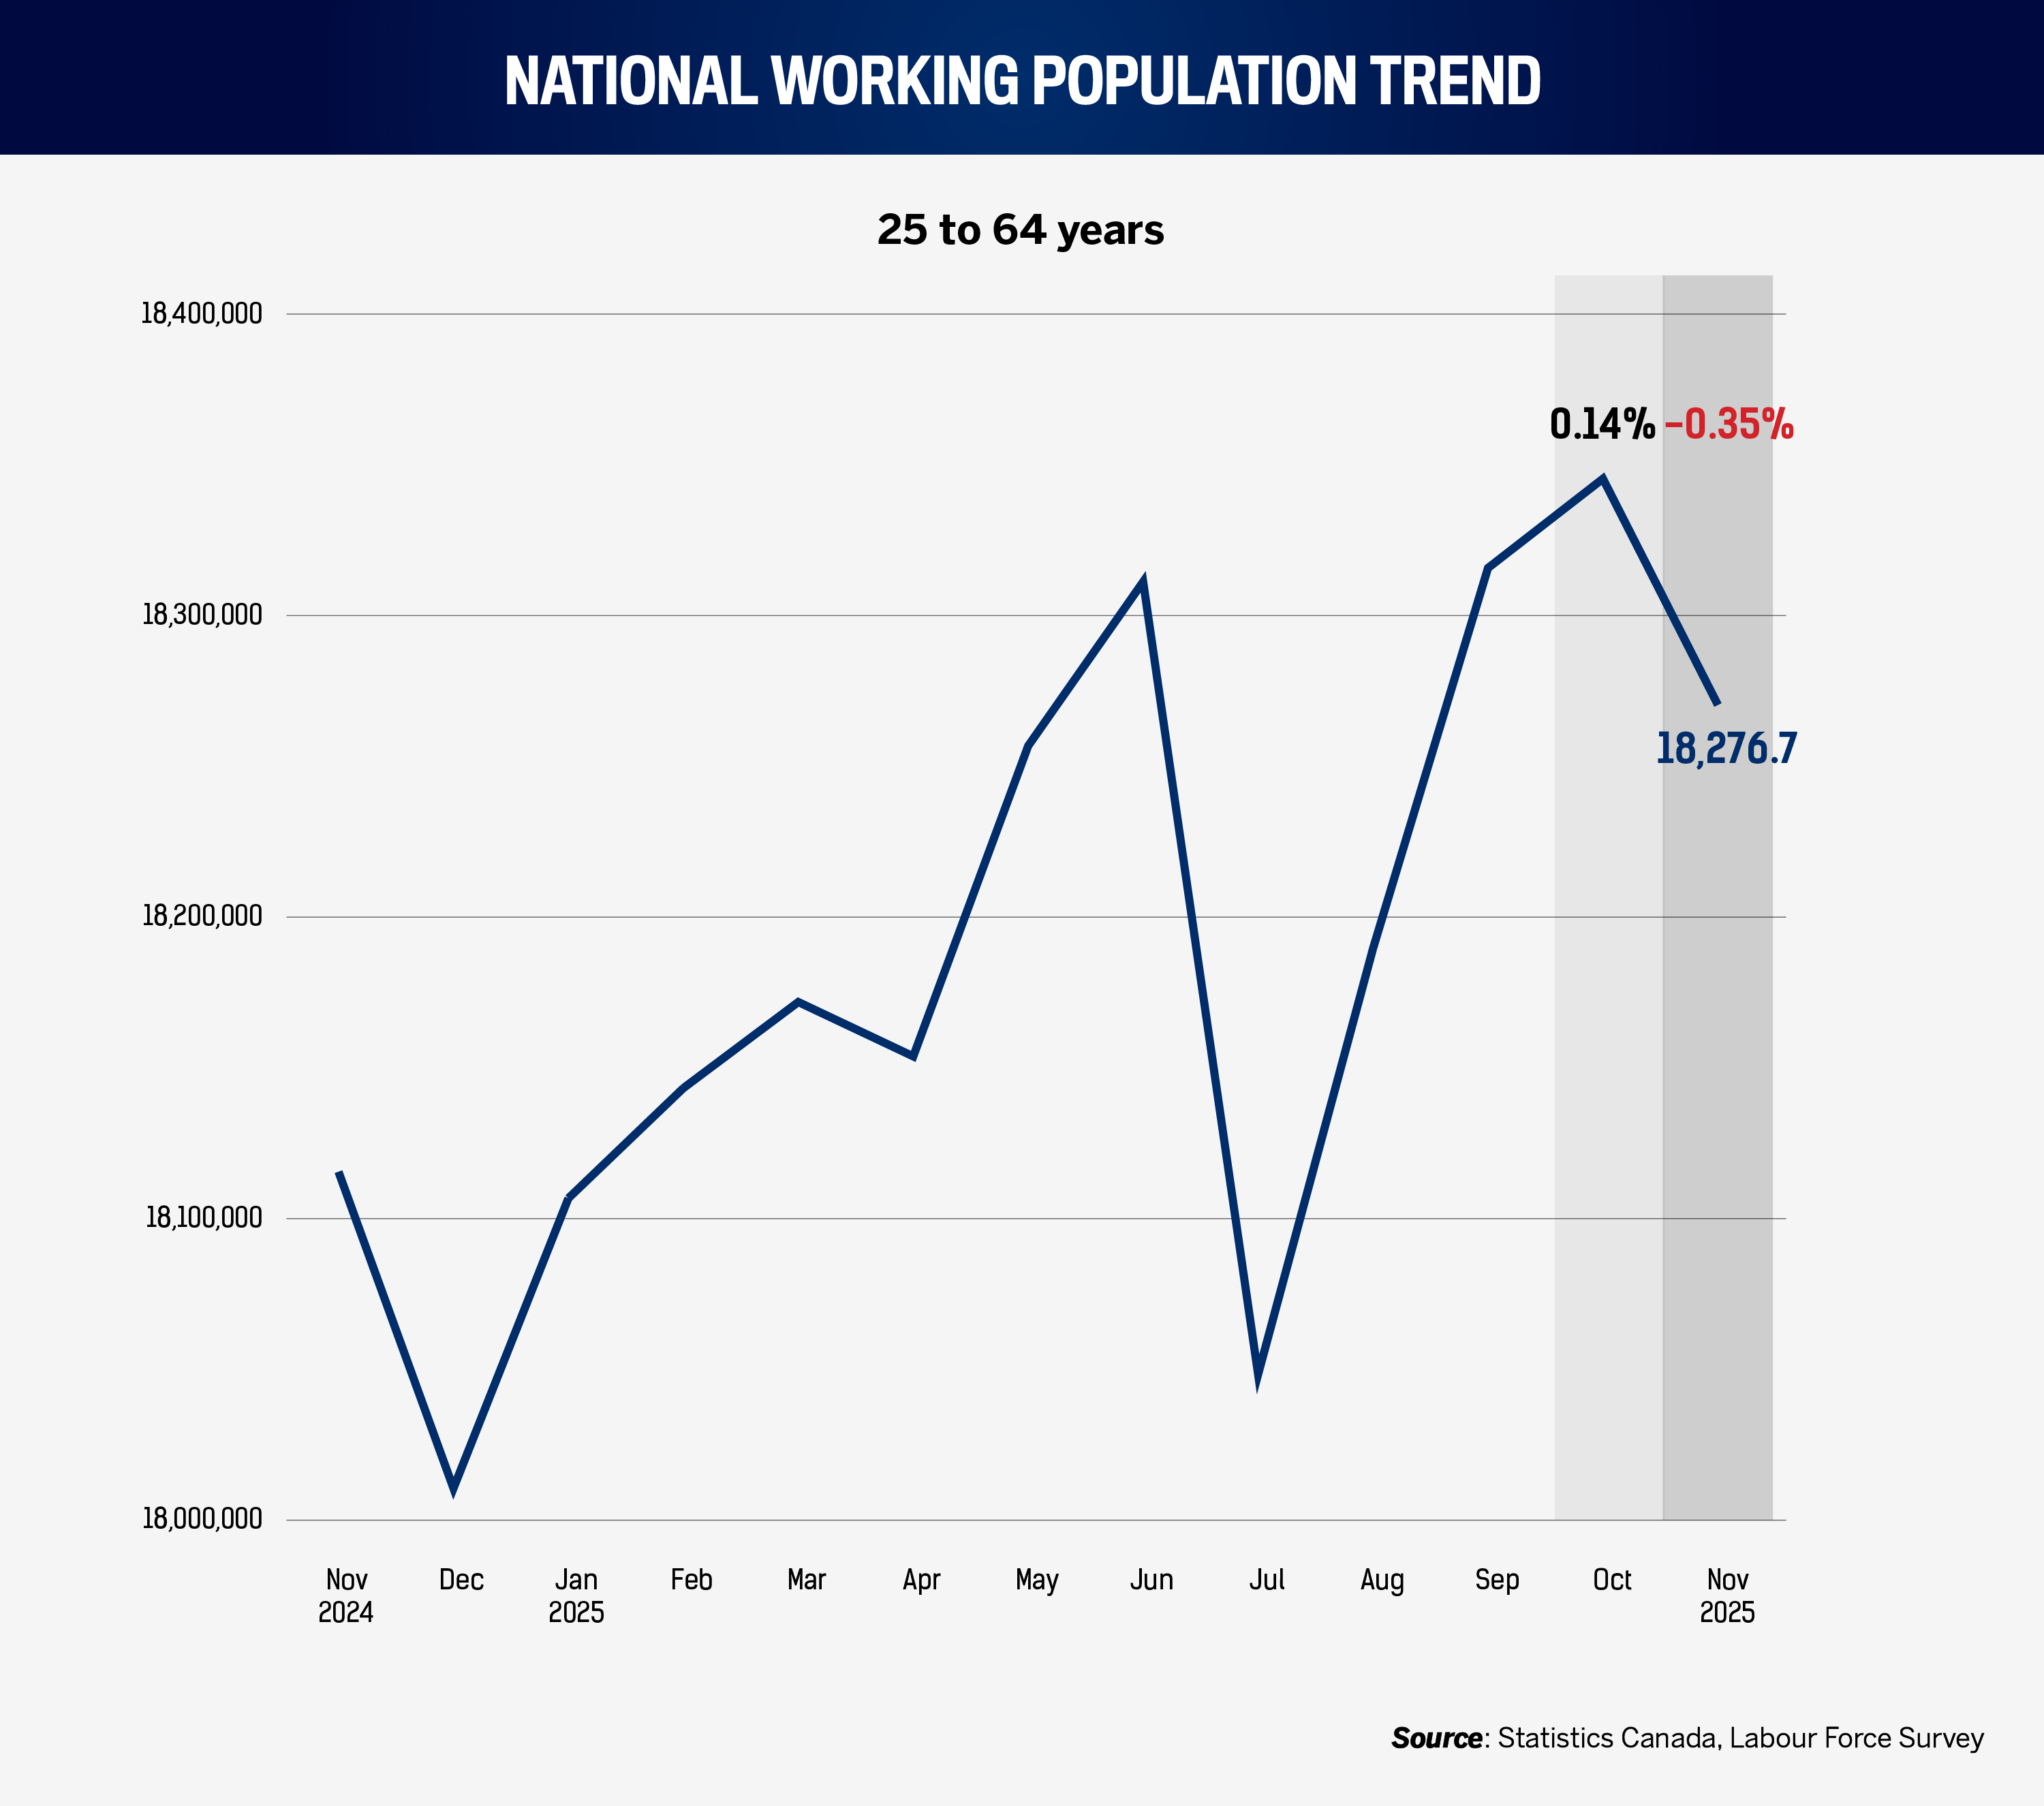
Labour supply is growing slowly but steadily. The prime working-age labour force (25–64) rose from 18.144 million in November 2024 to 18.277 million in November 2025, an increase of roughly 132,300 people, or 0.7 percent. From month to month, the series dipped from 18.341 million in October to 18.277 million in November, a decline of about 64,100.
Paired with a sharp YoY drop in vacancies and essentially flat payroll employment, this increase in supply implies fewer open doors per new worker. Practically, HR teams should expect longer shortlists, more candidates meeting minimum criteria, and greater scope to insist on structured, defensible assessment. Standards that were relaxed in the tightest post-pandemic months can be reasserted.
However, a 0.7 percent YoY rise in labour supply does not erase structural skill shortages, nor does it produce more licensed tradespeople, experienced supervisors, or senior compliance specialists. It primarily expands the pool of general labour and early-career talent. That pattern is mirrored in unemployment by age (see Section 5.B): younger cohorts have higher unemployment, deepening entry-level pools rather than specialist ones.
4.B. Provincial and city workforce changes
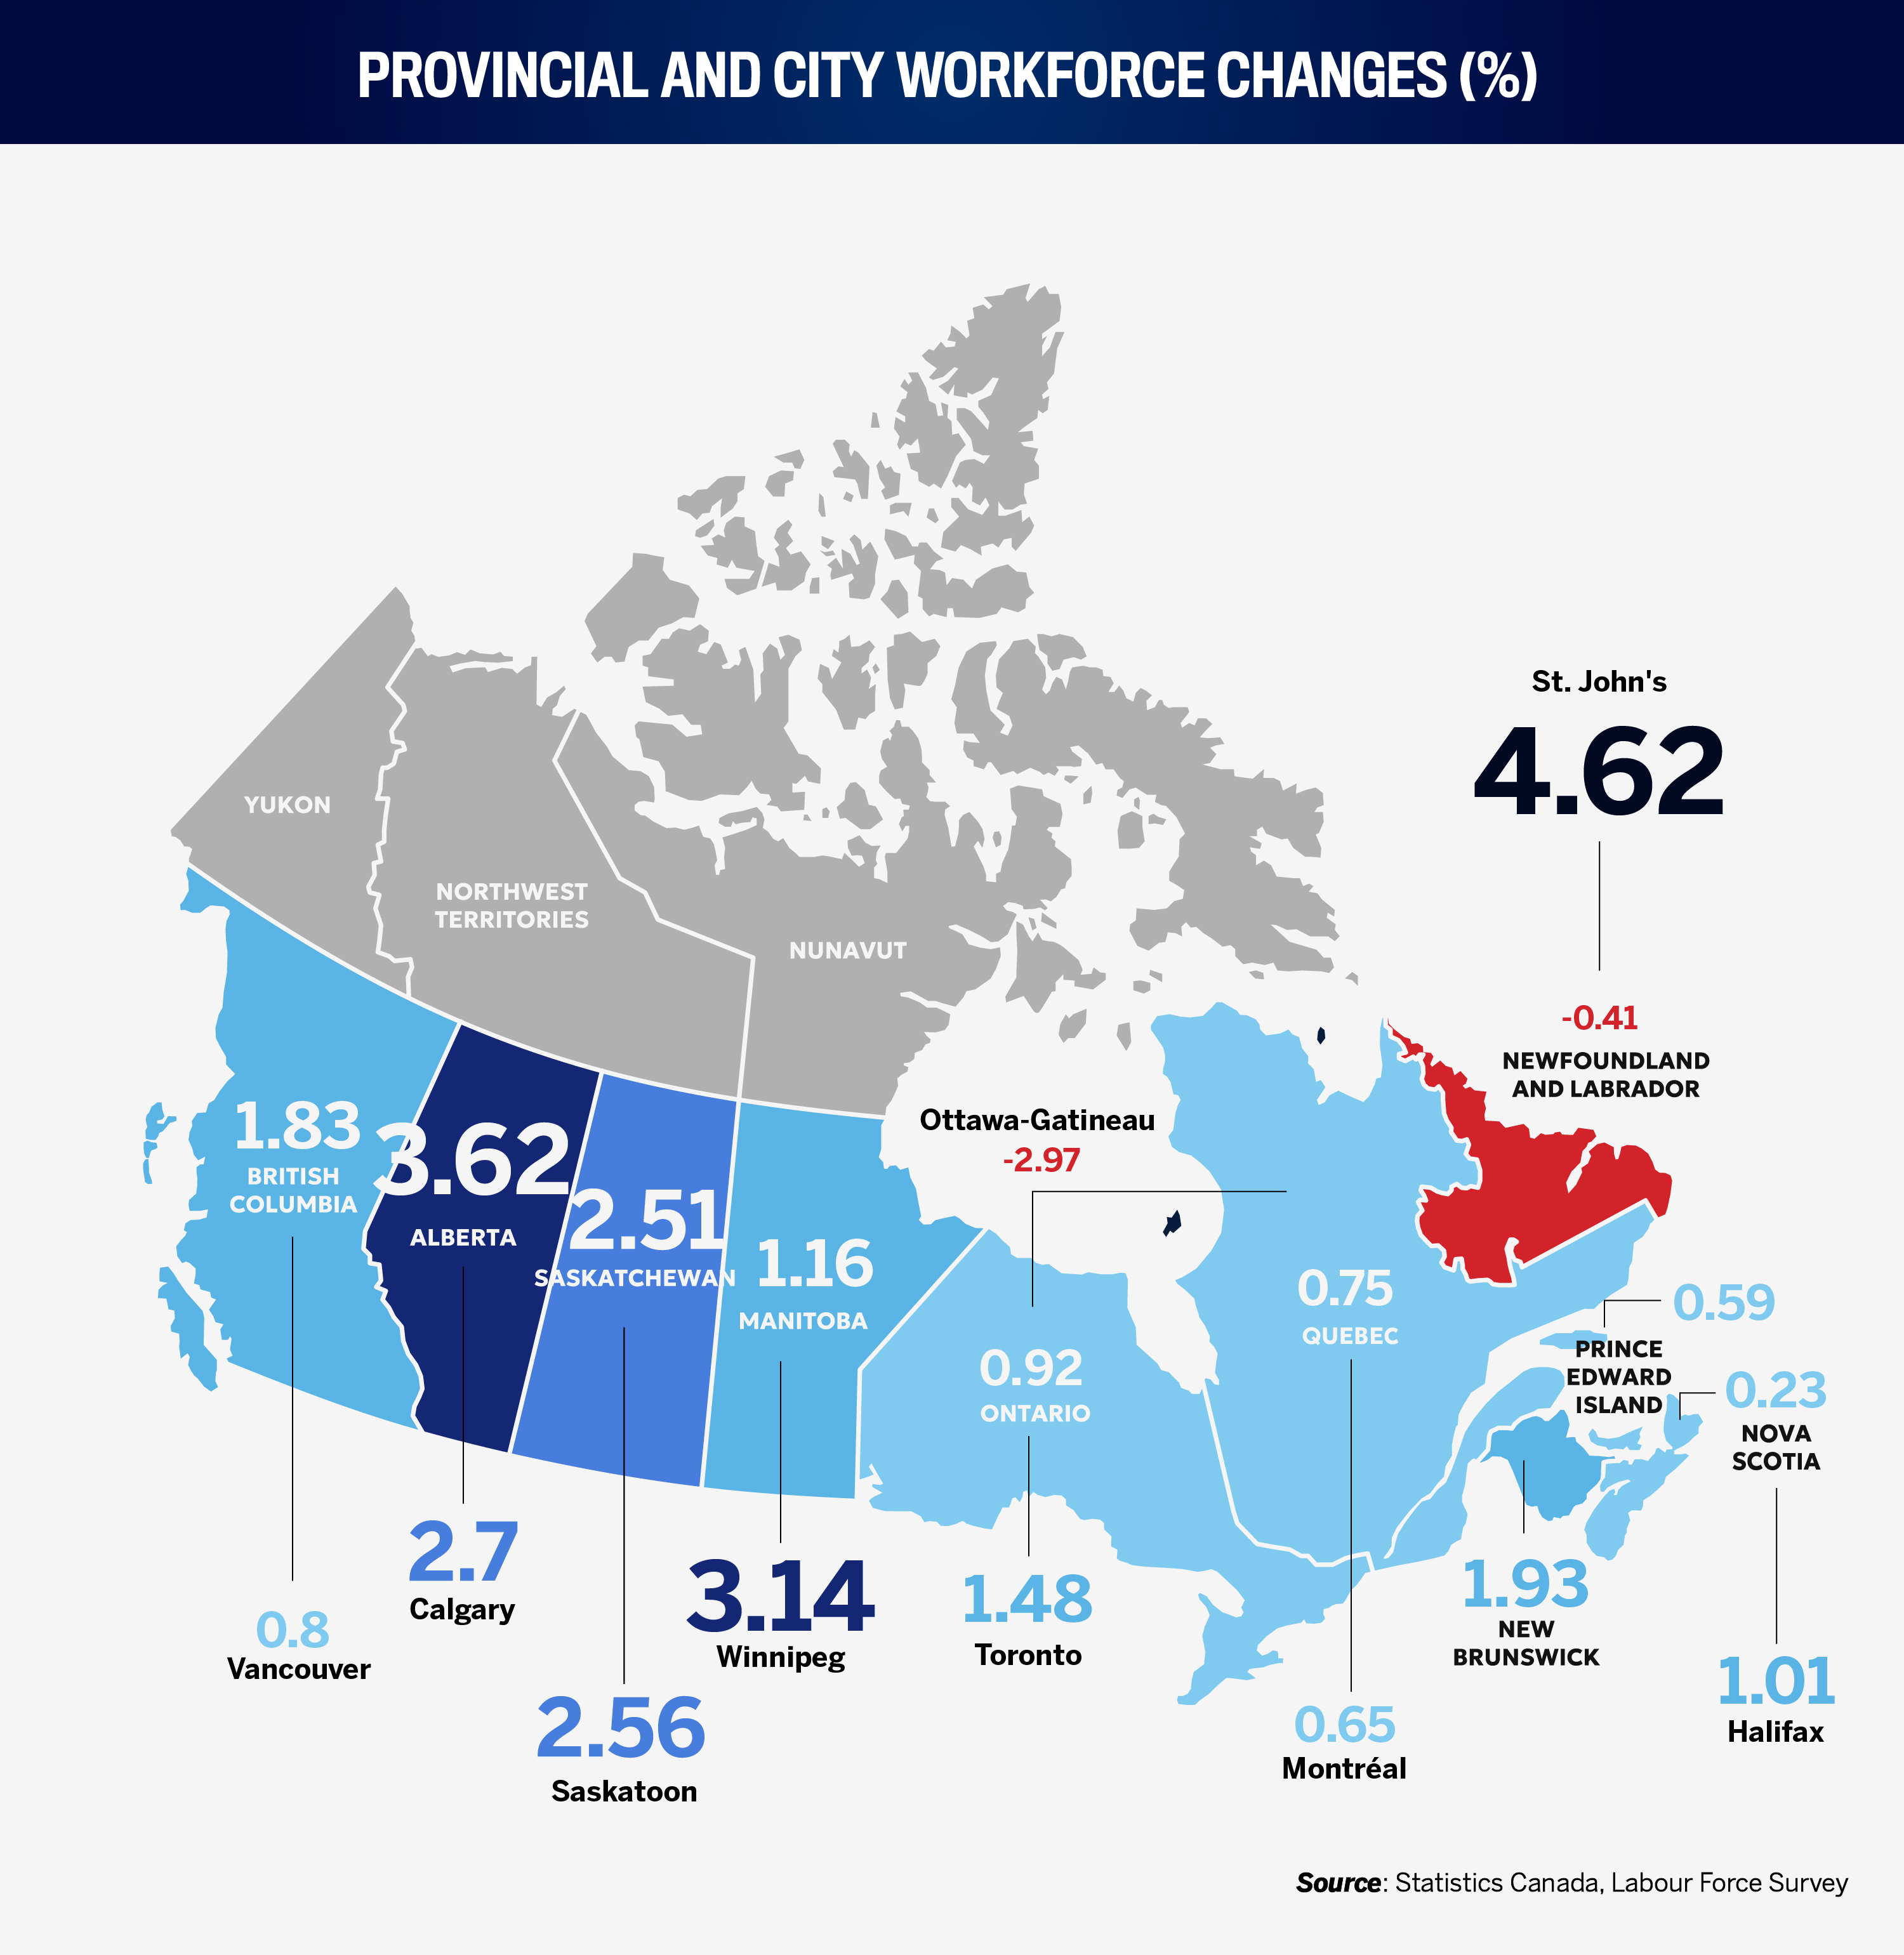
Regionally, Alberta continues to lead. Its labour force grew 3.6 percent, adding about 98,400 people to reach roughly 2.813 million. Saskatchewan followed with 2.5 percent growth, and British Columbia with 1.8 percent. Ontario’s increase was a more modest 0.9 percent, and Quebec’s was 0.8 percent. Newfoundland and Labrador’s labour force shrank by 0.4 percent.
At the city level, St. John’s posted 4.6 percent growth, and Winnipeg 3.1 percent. Calgary grew 2.7 percent, reinforcing the view of Western Canada as a deepening talent corridor when combined with Alberta’s provincial gains. Saskatoon rose 2.6 percent.
Ottawa–Gatineau stands out on the downside, with its labour force shrinking 3.0 percent (about 28,000 workers) YoY – a meaningful contraction in a market closely tied to government and public-adjacent employment.
For HR, these shifts suggest that recruitment strategies may need to be more geographically differentiated: Western Canada increasingly looks like the growth frontier, while some central and eastern markets grow more slowly or contract.
5. Unemployment
5.A. General unemployment by gender
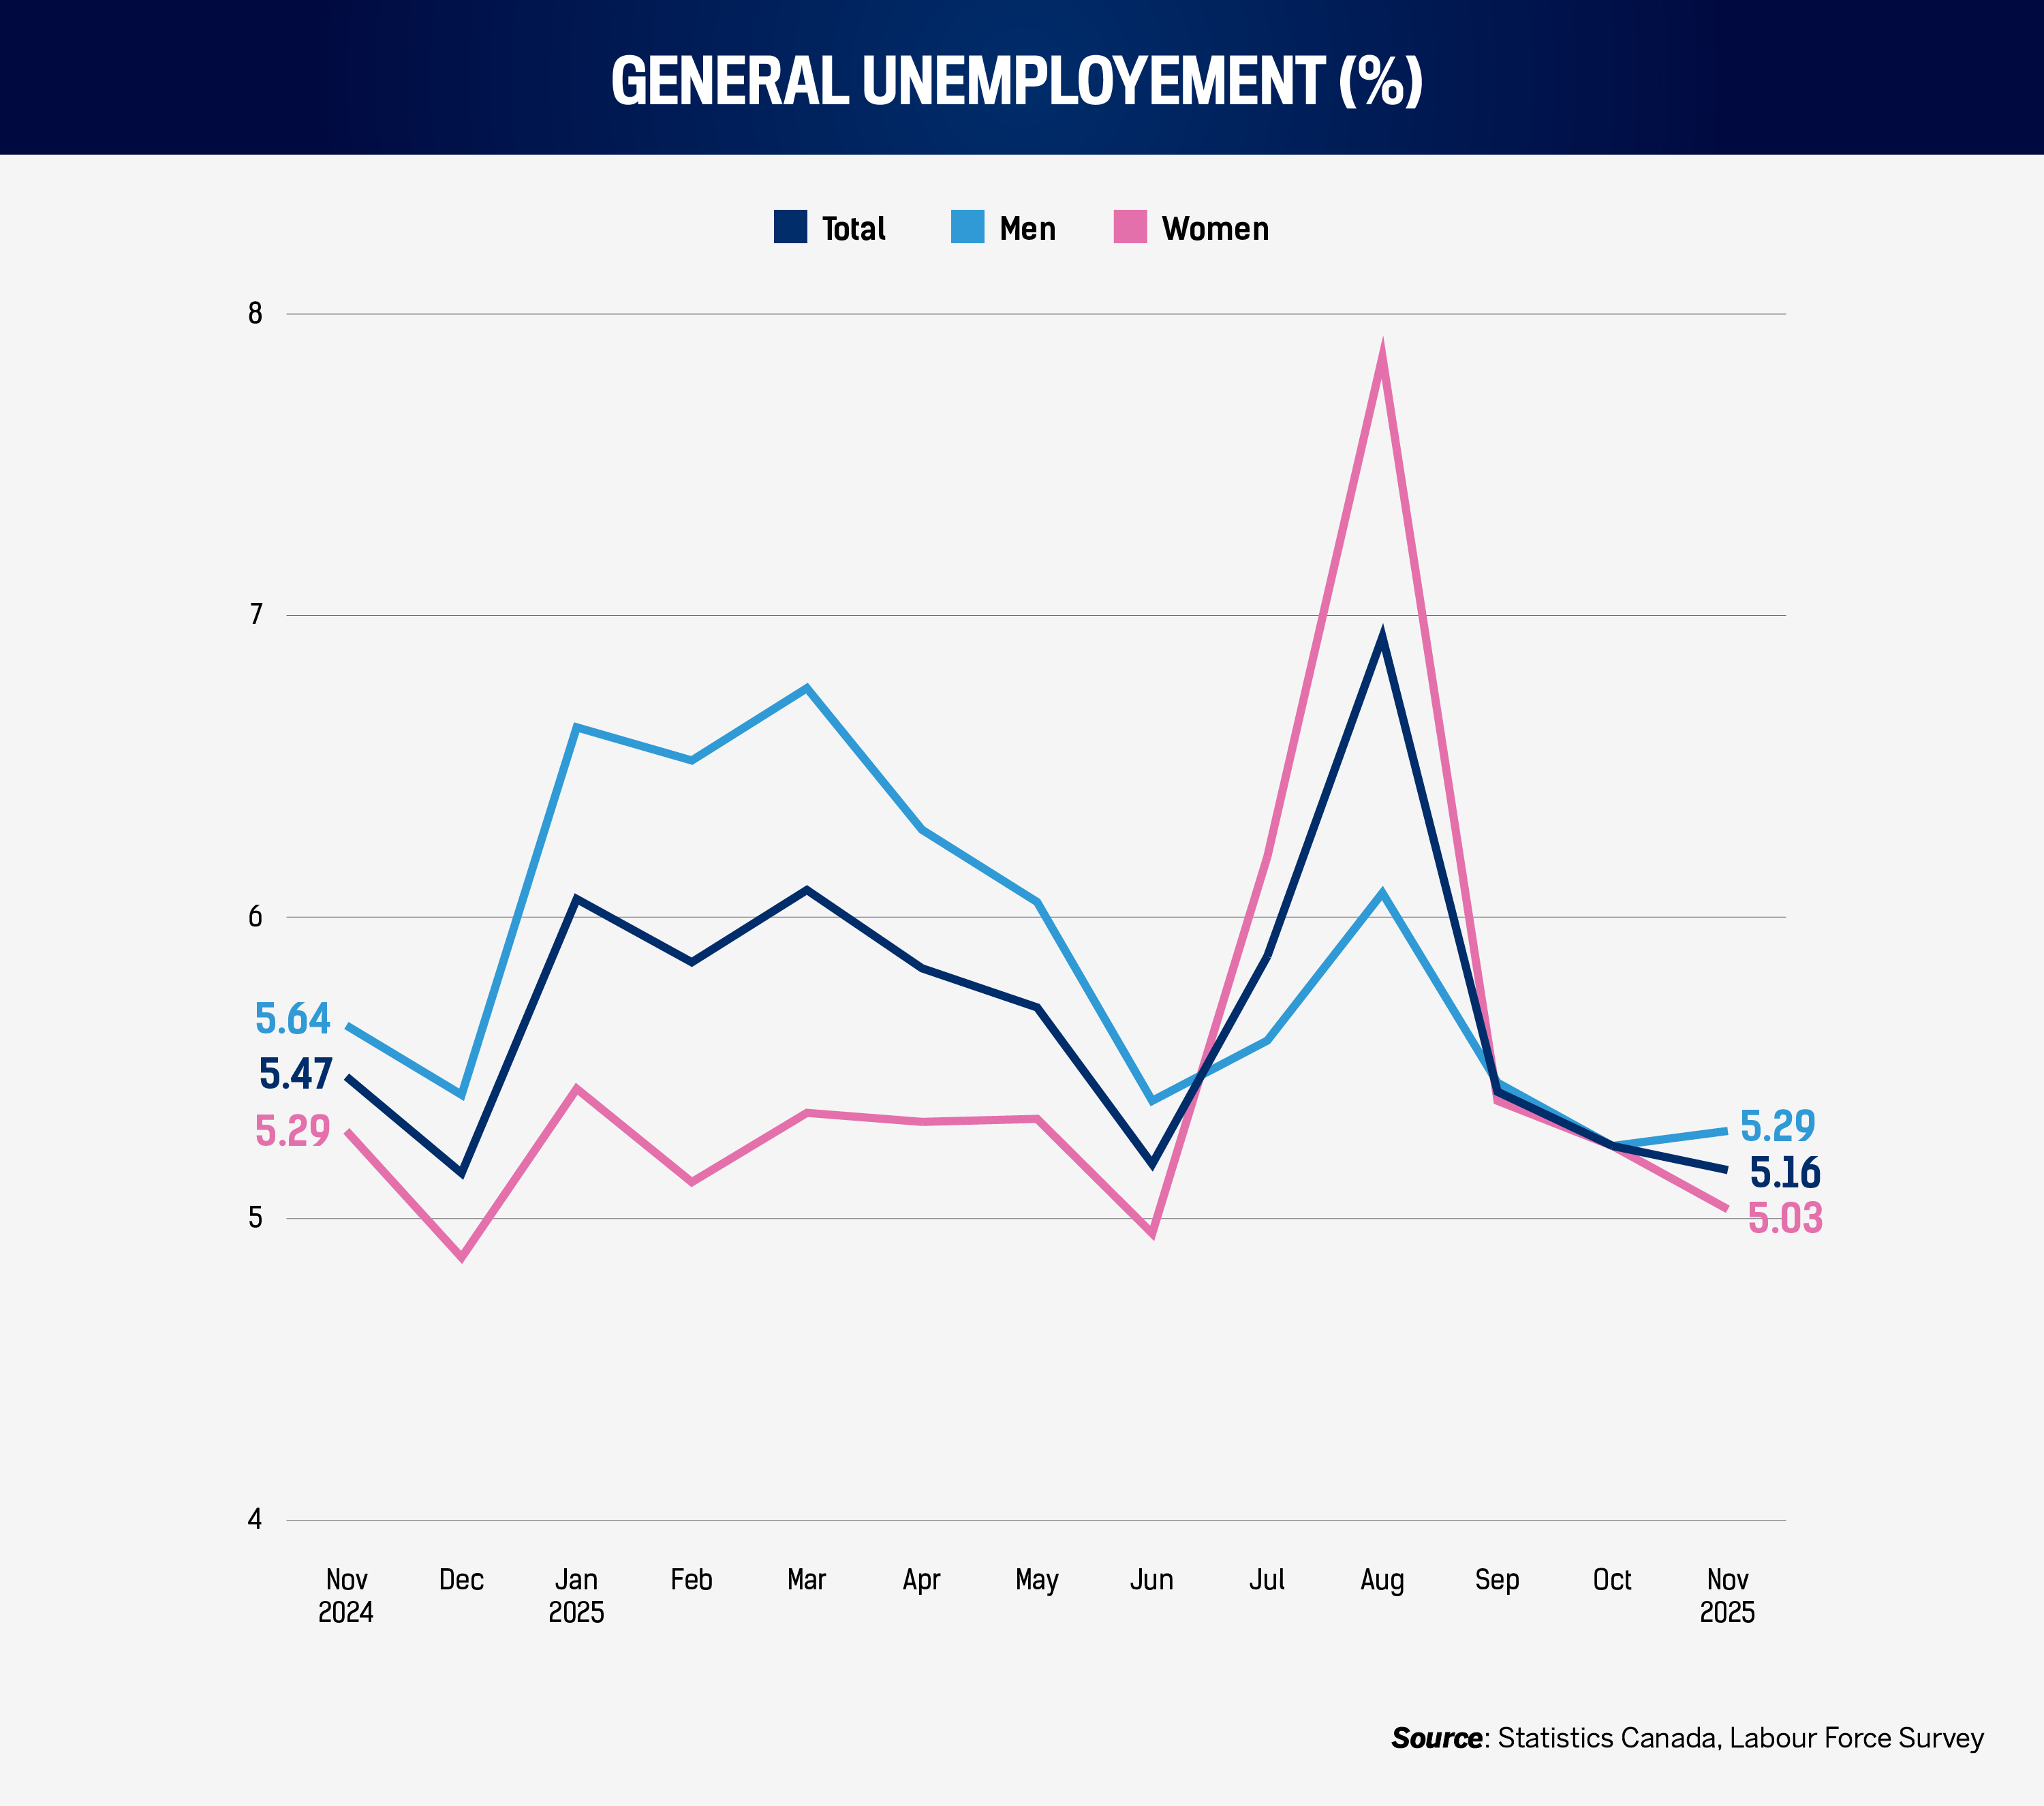
Prime-age unemployment (25–64) fell from 5.47 percent in November 2024 to 5.16 percent in November 2025, a 0.3 percentage-point improvement, with gains for both men and women. Overall unemployment peaked at 6.93 percent in August 2025, when women’s unemployment reached 7.86 percent, before easing back.
Vacancies have cooled sharply, but unemployment has not risen in a sustained way. This is consistent with an economy that is not shedding workers en masse but is more cautious about expansion: fewer new openings but relatively steady staffing.
For HR, that combination produces a subtle but important dynamic. Candidate availability improves at the margins, yet not because large cohorts are being displaced. Scarcity in specialist and high-credential roles can persist even as application volumes rise in generalist positions.
The August spike is a reminder of how quickly conditions can shift within a single year that ultimately looks stable in hindsight. Hiring plans and labour-cost forecasts should be stress-tested against intra-year volatility, not just annual averages – particularly in organizations exposed to seasonal demand, government funding cycles, or project-based work.
5.B. Unemployment by age and education
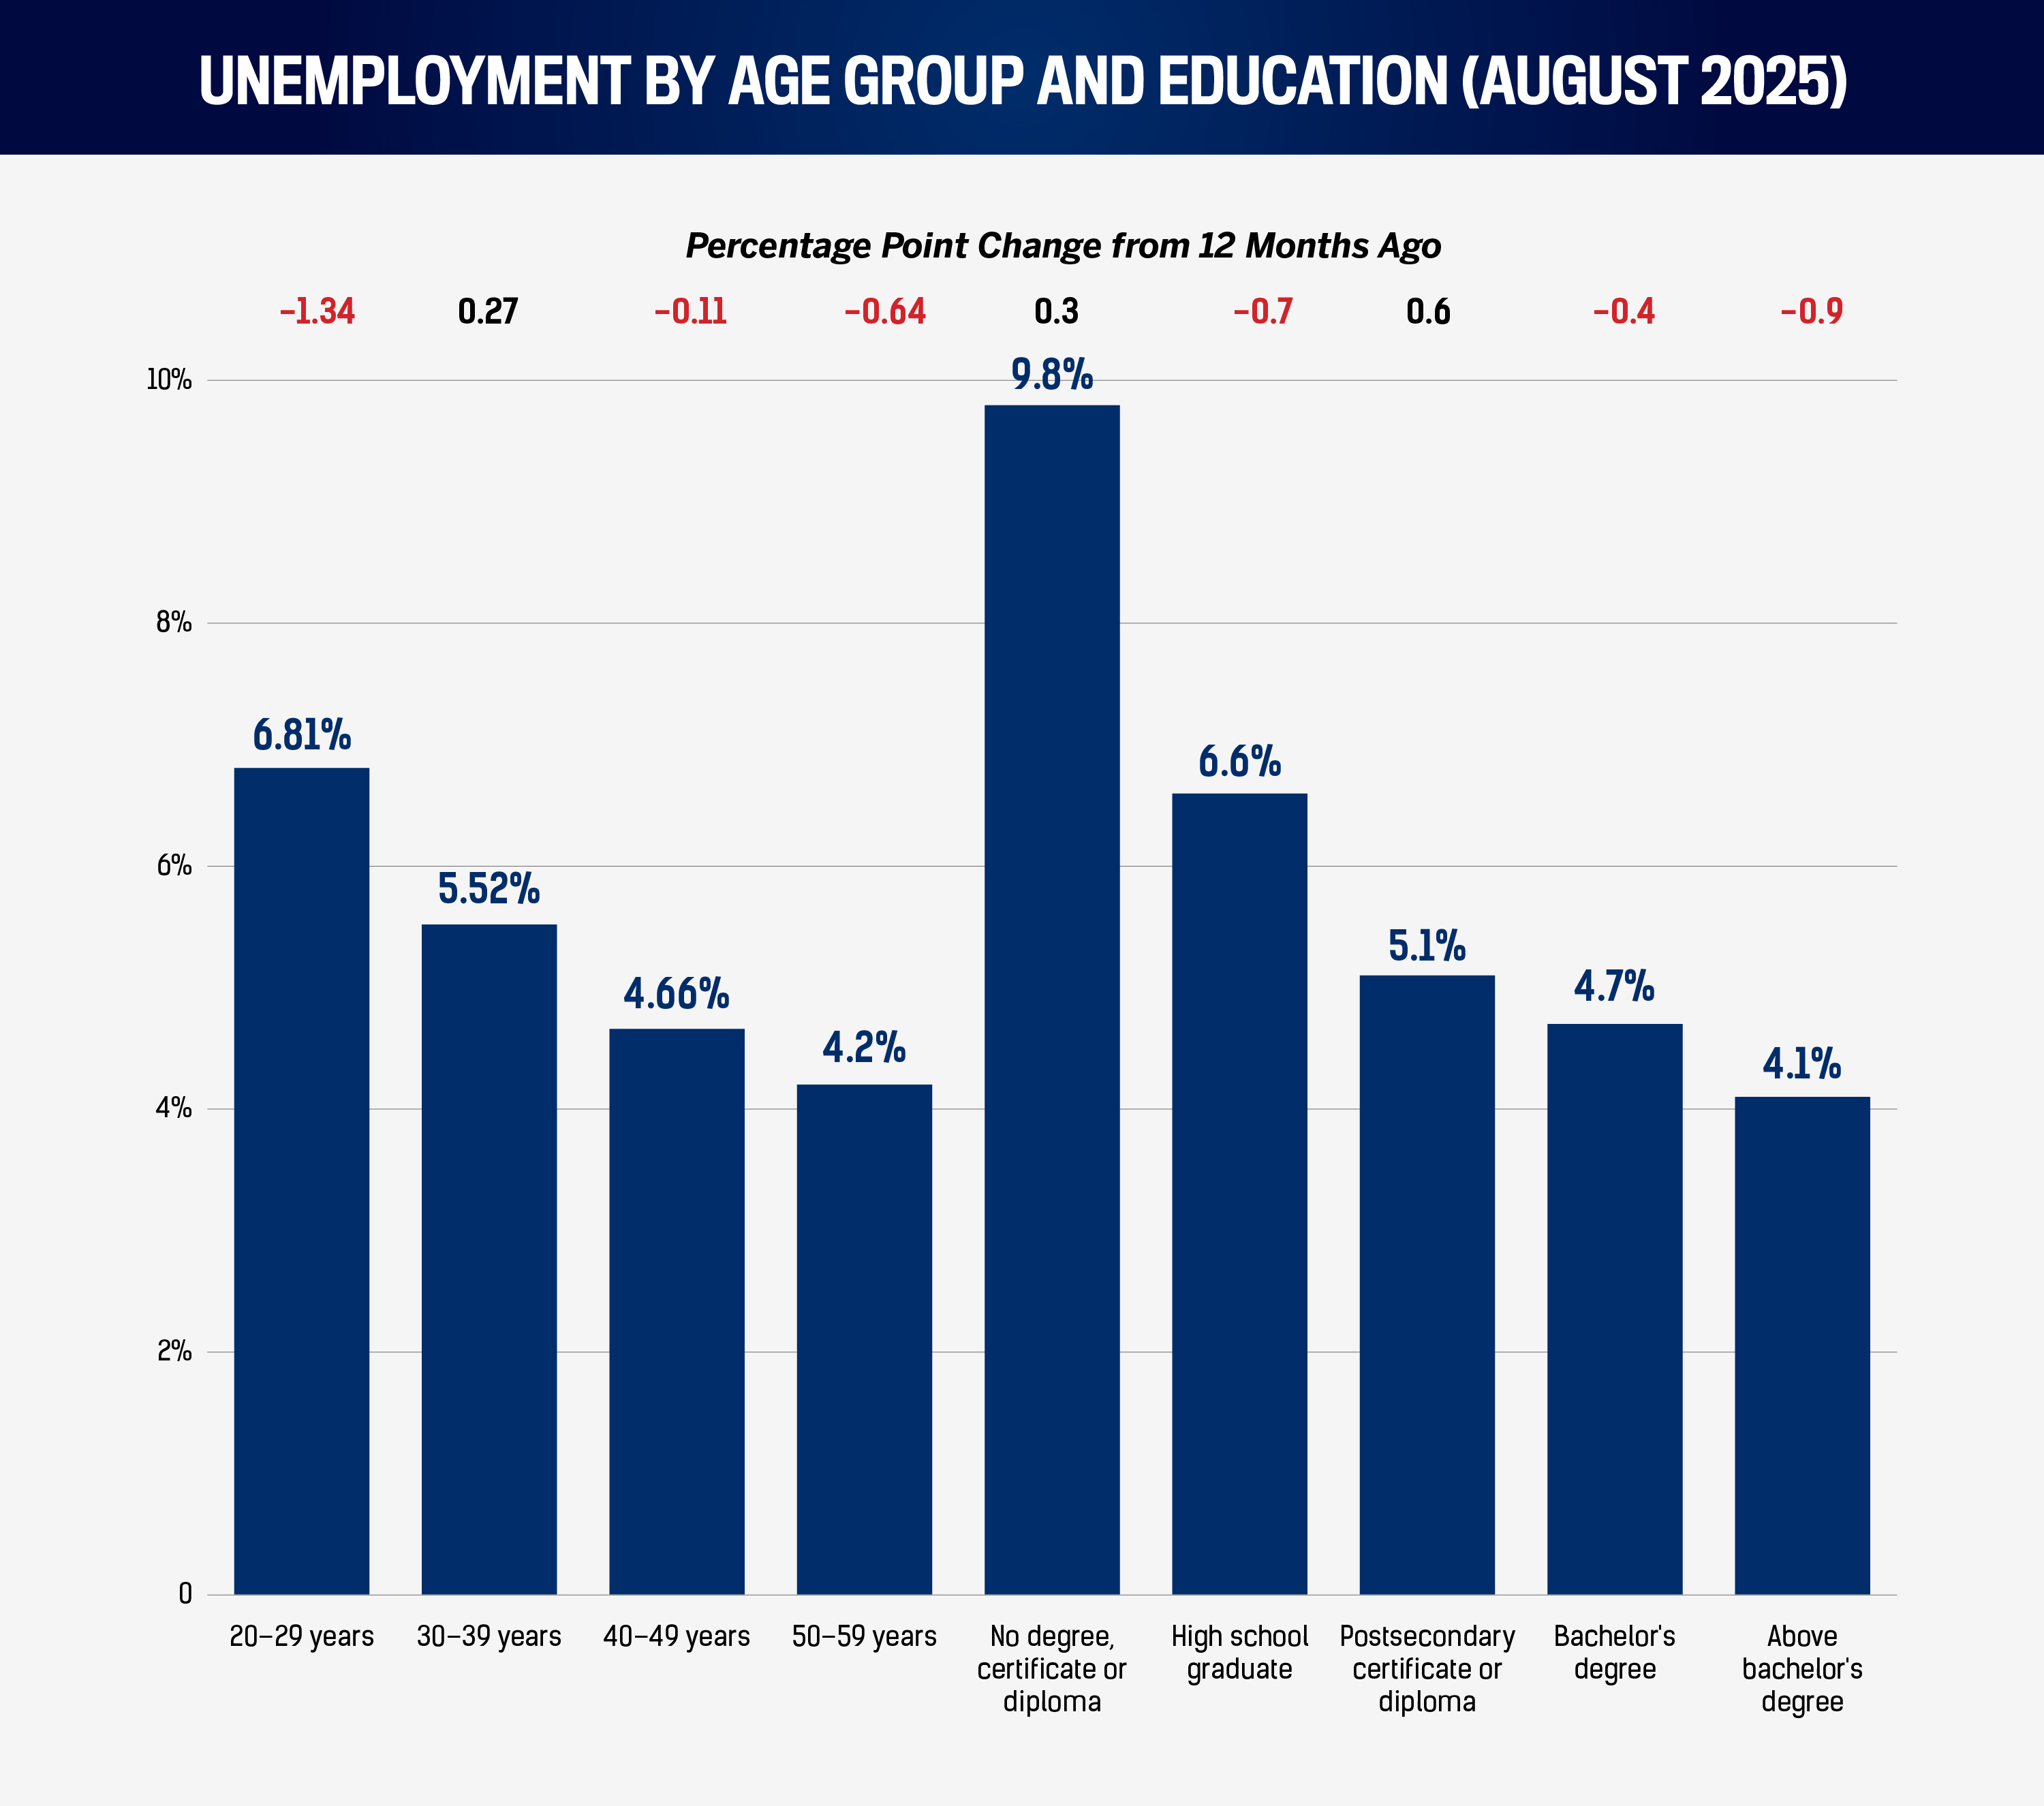
By age, unemployment remains highest among 20- to 29-year-olds, at 6.81 percent in November 2025, compared with 5.52 percent for those 30 to 39, 4.66 percent for 40- to 49-year-olds, and 4.20 percent for those 50 to 59. YoY, youth unemployment has improved significantly, falling from 8.15 percent to 6.81 percent, suggesting deeper, more stable entry-level talent pools than in late 2024.
The notable exception is workers in their 30s. Those 30- to 39-year-olds are the only age group whose unemployment rate rose compared with the previous edition’s data, from 4.9 percent to 5.52 percent, even as overall unemployment declined. For HR leaders, that points to a group that may feel increasingly squeezed: old enough to have accumulated responsibilities and expectations, yet newly more vulnerable in a selective market.
By education, workers without a degree, certificate, or diploma remain the most exposed, with unemployment at 9.80 percent in November 2025. High school graduates stand at 6.60 percent. Those with postsecondary certificates or diplomas are at 5.10 percent; bachelor’s degree holders are at 4.70 percent; and those with education beyond a bachelor’s degree are at 4.10 percent.
The immediate implication is that the highest-education categories remain relatively insulated. Competition for highly educated specialists is unlikely to evaporate simply because vacancies are down.
The more strategic concern lies in the middle of the credential distribution. Certificate and diploma holders are not in crisis, but they are less protected than higher-degree workers, and – like workers in their 30s – they experienced the only unemployment increase among those with some form of postsecondary education. In many organizations, this group forms the operational backbone: technicians, clerical and administrative staff, and junior supervisors.
If tenure is eroding in sectors that employ many of these mid-skill workers (Section 3), the response should be capability-building rather than complacency. That means clearer internal pathways into higher-demand roles, skills-based pay progression, and development programs that move mid-skill employees into scarce-skill categories.
The easing vacancy market, in other words, is not a reason to pause capability-building. It is the window in which to do it. When hiring is less frantic, organizations have more capacity to train, standardize, and document – steps that reduce both turnover and formal disputes when the next cycle tests the system again.


