Core-age unemployment spiked even as real wages finally climbed above inflation, underscoring a selective hiring environment. The recently well-performing finance, information and culture, and utilities industries remain the few adding job vacancies. Construction and professional services shed roles, and tenure fell. Tribunal caseloads surged again in Ontario and Nova Scotia

Canada’s labour market, which had been rebalancing through early summer, took a sharp turn in August: Although real wages rose above inflation for the first time since early year, unemployment rose dramatically and available jobs took a remarkable dip. Finance, information and culture, and utilities posted the strongest job vacancy gains year-over-year, while availabilities in construction, professional services, and retail have firmed. From August 2024 to August 2025, job tenure fell most notably in construction and finance, and tribunal caseloads rose chiefly across five boards in Ontario and Nova Scotia.
Executive overview
National job vacancy trends: available jobs decline significantly for the first time in 2025
- In June, job vacancies fell to 522,945 (−20,685 month-over-month (MoM); −62,675 year-over-year (YoY)), while payroll employees rose by 292,325 MoM and 55,820 YoY.
- Canada’s total vacancy rate declined to 2.91 percent in June from 3.07 percent in May and 3.25 percent a year earlier, signalling modestly easier hiring conditions in aggregate.
- The reduction of available aggregate masks notable areas of tighter hiring and compensation, visible in industry data (see “Industry-specific vacancies”) and in wage momentum (see “Wages”).
- HR implication: use the brief national job lull to secure hard-to-fill roles before sector hotspots re-tighten.
Industry-specific vacancies: finance, culture, and utilities add more jobs YoY, while most industries retract
- Only five industries posted YoY vacancy-rate growth in June: finance and insurance (+18.6 percent), information and culture (+14.9 percent), utilities (+11.4 percent), real estate and leasing (+6.9 percent), and “other services,” which include personal care and niche consumer businesses (+5 percent).
- The strongest increases cluster in high-skill and regulated environments (finance and utilities) and in content-driven sectors (information and culture), where demand for specialized roles remains acute.
- In June, supporting earlier-mentioned job declines, the majority of sectors recorded YoY declines in vacancy rates, led by transportation and warehousing (−23.5 percent), management companies (−21.8 percent), and health care (−20.0 percent).
- HR implication: reallocate recruiting capacity toward the five growth sectors; elsewhere, use the employer’s market to improve hiring quality rather than simply lowering offers.
Wages vs. inflation: median wages rise faster than inflation, bringing real wages above cost increases for the first time in months
- Median hourly wages rose to $35 in August, up $1.36 YoY (+4 percent).
- The CPI index increased from 161.8 to 164.8 over the same period (~+1.9 percent), implying real wage gains of roughly $0.62.
- Real wage tailwinds persist despite August’s unemployment spike (6.92 percent for ages 25–64), suggesting employees will benchmark offers against purchasing-power gains.
- HR implication: 2025 merit budgets that assumed 3 percent may now feel tight; prioritize differentiated awards and non-pay levers in tight pockets (see “Industry-specific vacancies” and “Wages”).
Industry-specific wages: top wage increases YoY mirror few industries with increased availability
- The 10 fastest-growing industries for median wages (YoY to August) included:
- Information, culture, and recreation (+9.1 percent to $36.00)
- Agriculture (+7.2 percent to $25.00)
- Other services (+7.1 percent to $30.00)
- Information, culture, and recreation (+9.1 percent to $36.00)
- Wage momentum has a clear “ladder” shape: strong gains in lower-paid, operational sectors (agriculture and other services) alongside continued pressure in knowledge and critical-infrastructure roles.
- HR implication: budget for targeted compression fixes in mixed teams; floor roles are rising faster, squeezing differentials with intermediate grades.
Industry gender wage gaps: utilities flip toward parity, and many reverse the male-female wage gap
- The gender pay gap widened most (Aug-over-Aug) in information, culture, and recreation (+$1.70 to $4.84; +54.1 percent); wholesale and retail (+$1.61 to $5.05; +46.8 percent); utilities (gap moved toward parity from −$2.88 to −$1.70; +41.0 percent on the male–female differential); agriculture (+$1.15 to $4.15; +38.3 percent); and manufacturing (+$0.75 to $3.00; +33.3 percent).
- Construction (+$1.05 to $6.46; +19.4 percent), educational services (+$0.83 to $3.76; +28.3 percent), other services (+$1.60 to $6.60; +32.0 percent), and finance/insurance/real estate/leasing (+$1.20 to $9.94; +13.7 percent) also posted larger gaps.
- Health care narrowed slightly (−$0.12 to $1.88), as did public administration (−$0.42 to $4.55) and professional, scientific, and technical (−$1.53 to $10.44).
- HR implication: widening gaps cluster in sectors with fast wage growth and/or shifting role mix; conduct role-level equity audits before year-end cycles.
Tenure: wage-growing industries fail to stop falling retention
- The steepest tenure declines (Aug-over-Aug) occurred in construction (−5.6 months; −6.0 percent) and other services (−5.4; −5.4 percent), followed by finance/insurance/real estate/leasing (−4.8; −4.4 percent) and utilities (−4.0; −2.9 percent).
- Information, culture, and recreation (−1.8; −2.1 percent), transportation and warehousing (−0.9; −0.9 percent), public administration (−0.7; −0.6 percent), and accommodation and food (−0.2; −0.4 percent) also fell.
- Agriculture (+3.0; +1.7 percent) and business support services (+1.3; +1.6 percent) were among the few to improve.
- HR implication: wage gains alone are not stabilizing retention in several high-pressure sectors; scheduling, safety, supervisor development, and mobility pathways are decisive.
Litigation: Ontario Labour Board caseload continues to surge, led by construction disputes
- Five tribunals recorded the largest YoY increases in decisions in August: Again, Ontario Labour Relations Board (+59), followed by Nova Scotia Workers’ Compensation Appeals Tribunal (+7), Nova Scotia Labour Board (+6), Ontario Law Society Tribunal (+5), and British Columbia Employment Standards Tribunal (+4).
- Themes: construction-sector certification and unfair labour practice disputes in Ontario; injury, impairment, and return-to-work determinations in Nova Scotia; and scheduling and wage compliance issues in B.C. employment standards.
- HR implication: documentation discipline, early accommodation, and union-relations governance are the primary risk controls in 2H 2025.
- Action: rehearse playbooks for certification drives, and audit injury management/return-to-work practices before peak seasonal volumes.
National workforce trends: expanding labour pool concerning amid job vacancies
- Canada’s core working-age population (25–64) rose to 18.21 million in August, up 226,400 YoY (+1.26 percent) and 120,700 MoM (+0.67 percent).
- The August rebound followed a July dip, indicating renewed labour-supply momentum heading into autumn.
- With June’s job vacancies lowering and payrolls up, the absorption of new entrants is improving but remains uneven by sector.
- HR implication: strengthen screening for transferable skills; the supply tailwind won’t by itself solve specialist shortages.
Provincial and city workforce changes: Alberta leads growth, and Quebec and Ontario add scale
- Provinces with the fastest YoY growth in core-age workforce: Alberta (+3.07 percent; +84,300), Quebec (+2.54 percent; +123,900), and Saskatchewan (+2.46 percent; +16,000).
- Largest absolute gains: Quebec (+123,900 to 4.997m), Ontario (+122,100 to 9.040m), and Alberta (+84,300 to 2.829m).
- Among cities, Toronto (+78,800), Montréal (+58,200), and Vancouver (+52,300) recorded the largest gains; Calgary (+36,100) and Winnipeg (+12,300) also grew strongly.
- HR implication: adopt a polycentric recruiting model – Calgary and Winnipeg deliver talent scale with less competition; Ottawa–Gatineau and Saint John contracted modestly.
National unemployment trends: as job options recede, unemployment spikes remarkably
- Core-age unemployment rose to 6.92 percent in August from 5.85 percent in July and 6.32 percent in August 2024.
- Women’s unemployment increased more sharply (to 7.79 percent) than men’s (to 6.14 percent); the gender gap is now −1.65 p.p. (women higher).
- The August spike coincides with easing vacancy rates (June) but rising payrolls, indicating more selective hiring and possible role re-profiling.
- HR implication: expect larger candidate pools and longer shortlists; use structured screens to prevent bias as volumes rise
Unemployment by age and education: degrees face higher unemployment than no credentials
- By age (Aug): unemployment rose across cohorts – 20–29 (10.38 percent; +1.03 p.p. MoM; +0.92 YoY), 30–39 (6.69 percent; +1.19 MoM; +0.18 YoY), 40–49 (6.18 percent; +0.62 MoM; +0.84 YoY), and 50–59 (6.61 percent; +1.11 MoM; +0.81 YoY).
- By education (Aug): no-credential unemployment fell YoY (9.8 percent; −0.7 p.p.) but rose with education level: post-secondary (6.5 percent; +1.0), bachelor’s (6.6 percent; +0.7), and above bachelor’s (7.0 percent; +0.1).
- The steepest MoM increases were among 30–39s (+1.19 p.p.) and above-bachelor’s (+1.5 p.p.).
- HR implication: mid-career and highly educated candidates are back on the market; rebalance sourcing toward transferable experience and re-entry programs.
National job vacancy trends: available jobs decline significantly for the first time in 2025
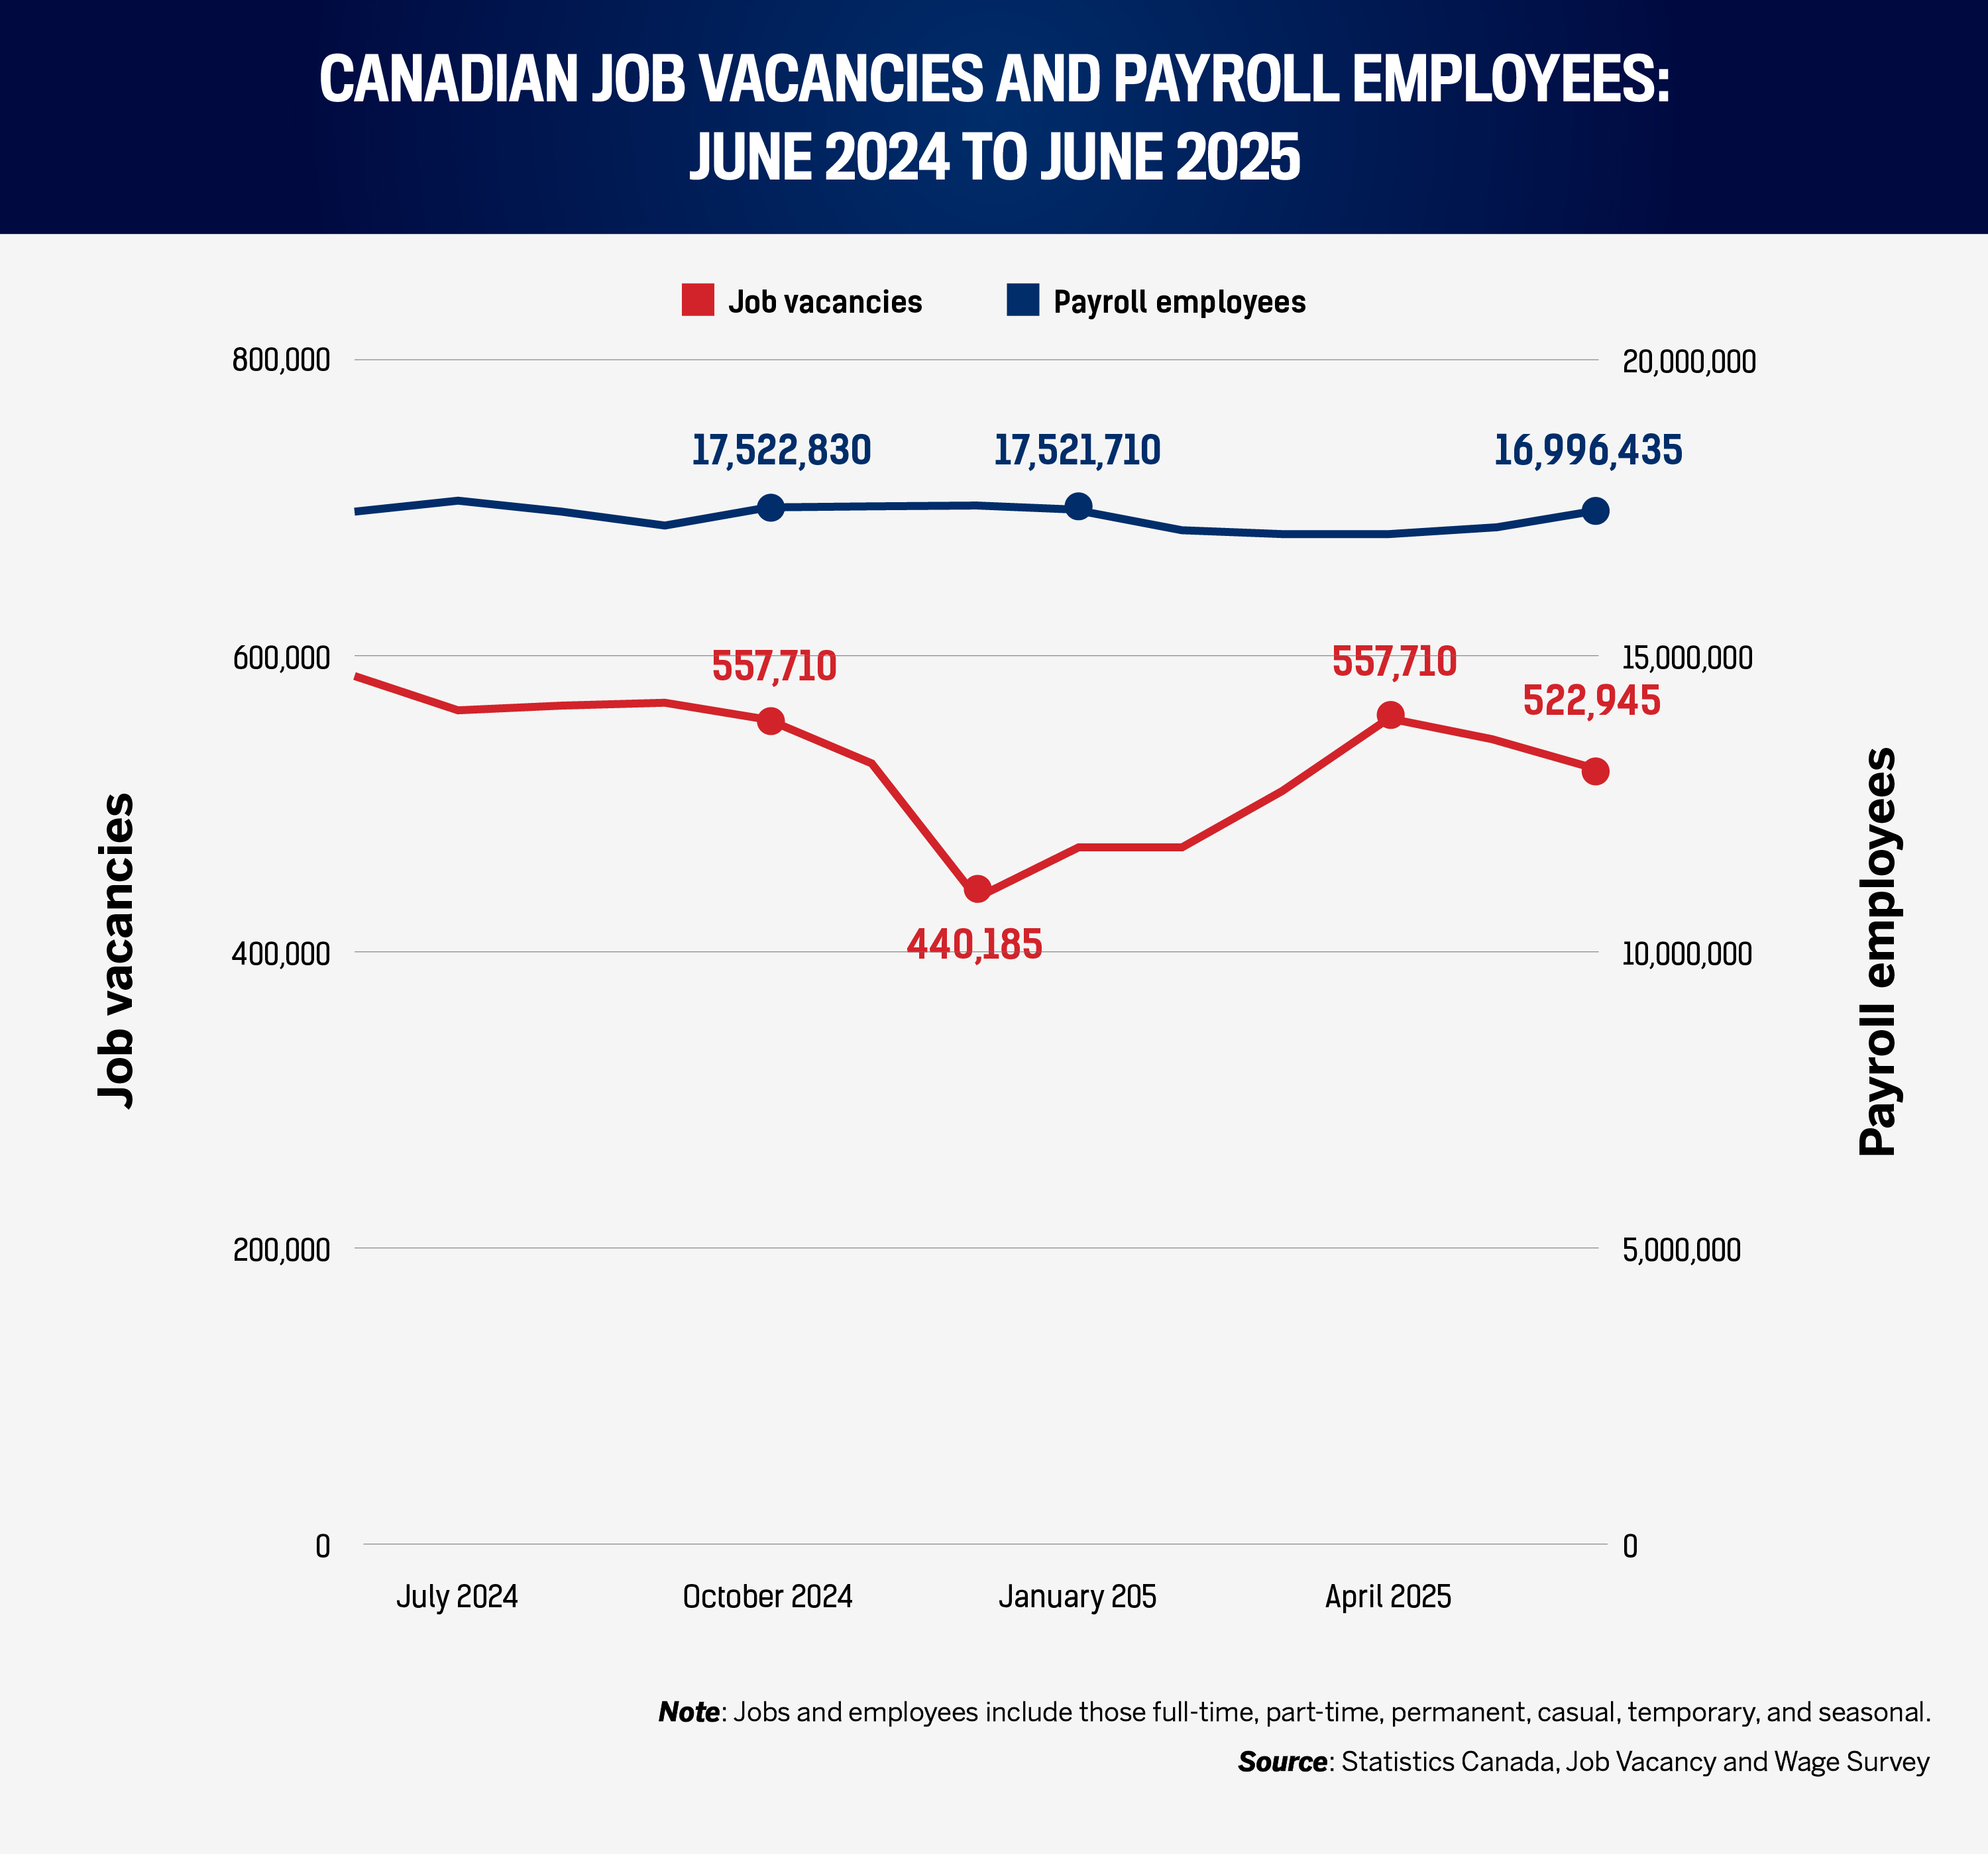
Canada’s June snapshot points to a mild release of pressure. Job vacancies slipped to 522,945 in June (−20,685 month-over-month (MoM); −62,675 year-over-year (YoY)), even as payroll employees climbed to 17,468,915 (+292,325 MoM; +55,820 YoY). Taken together, the vacancy rate (vacancies as a share of filled and unfilled posts) fell to 2.91 percent from 3.07 percent in May and 3.25 percent in June 2024. For national talent acquisition teams, that combination means positions should, on average, be marginally easier to fill than earlier in the year.
The aggregate, however, conceals important differences by industry and region. As the following industry-specific information shows, job opportunity growth is strong in finance and insurance and in information and culture, two areas that are also near the top of this month’s wage-growth rankings. Fewer available jobs, but high demand in a few sectors, may increase the “noise” toward certain applications; more resumes chasing highly specialized roles. HR leaders should use the wider national pool to build pipelines for specialist roles tied to transformation, data, and risk. Where job vacancies have genuinely receded (manufacturing, construction), it is an opportunity to reset expectations on starting pay while protecting internal equity (see “Gender wage gaps”).
Industry-specific vacancies: finance, culture, and utilities add more jobs YoY, while most industries retract
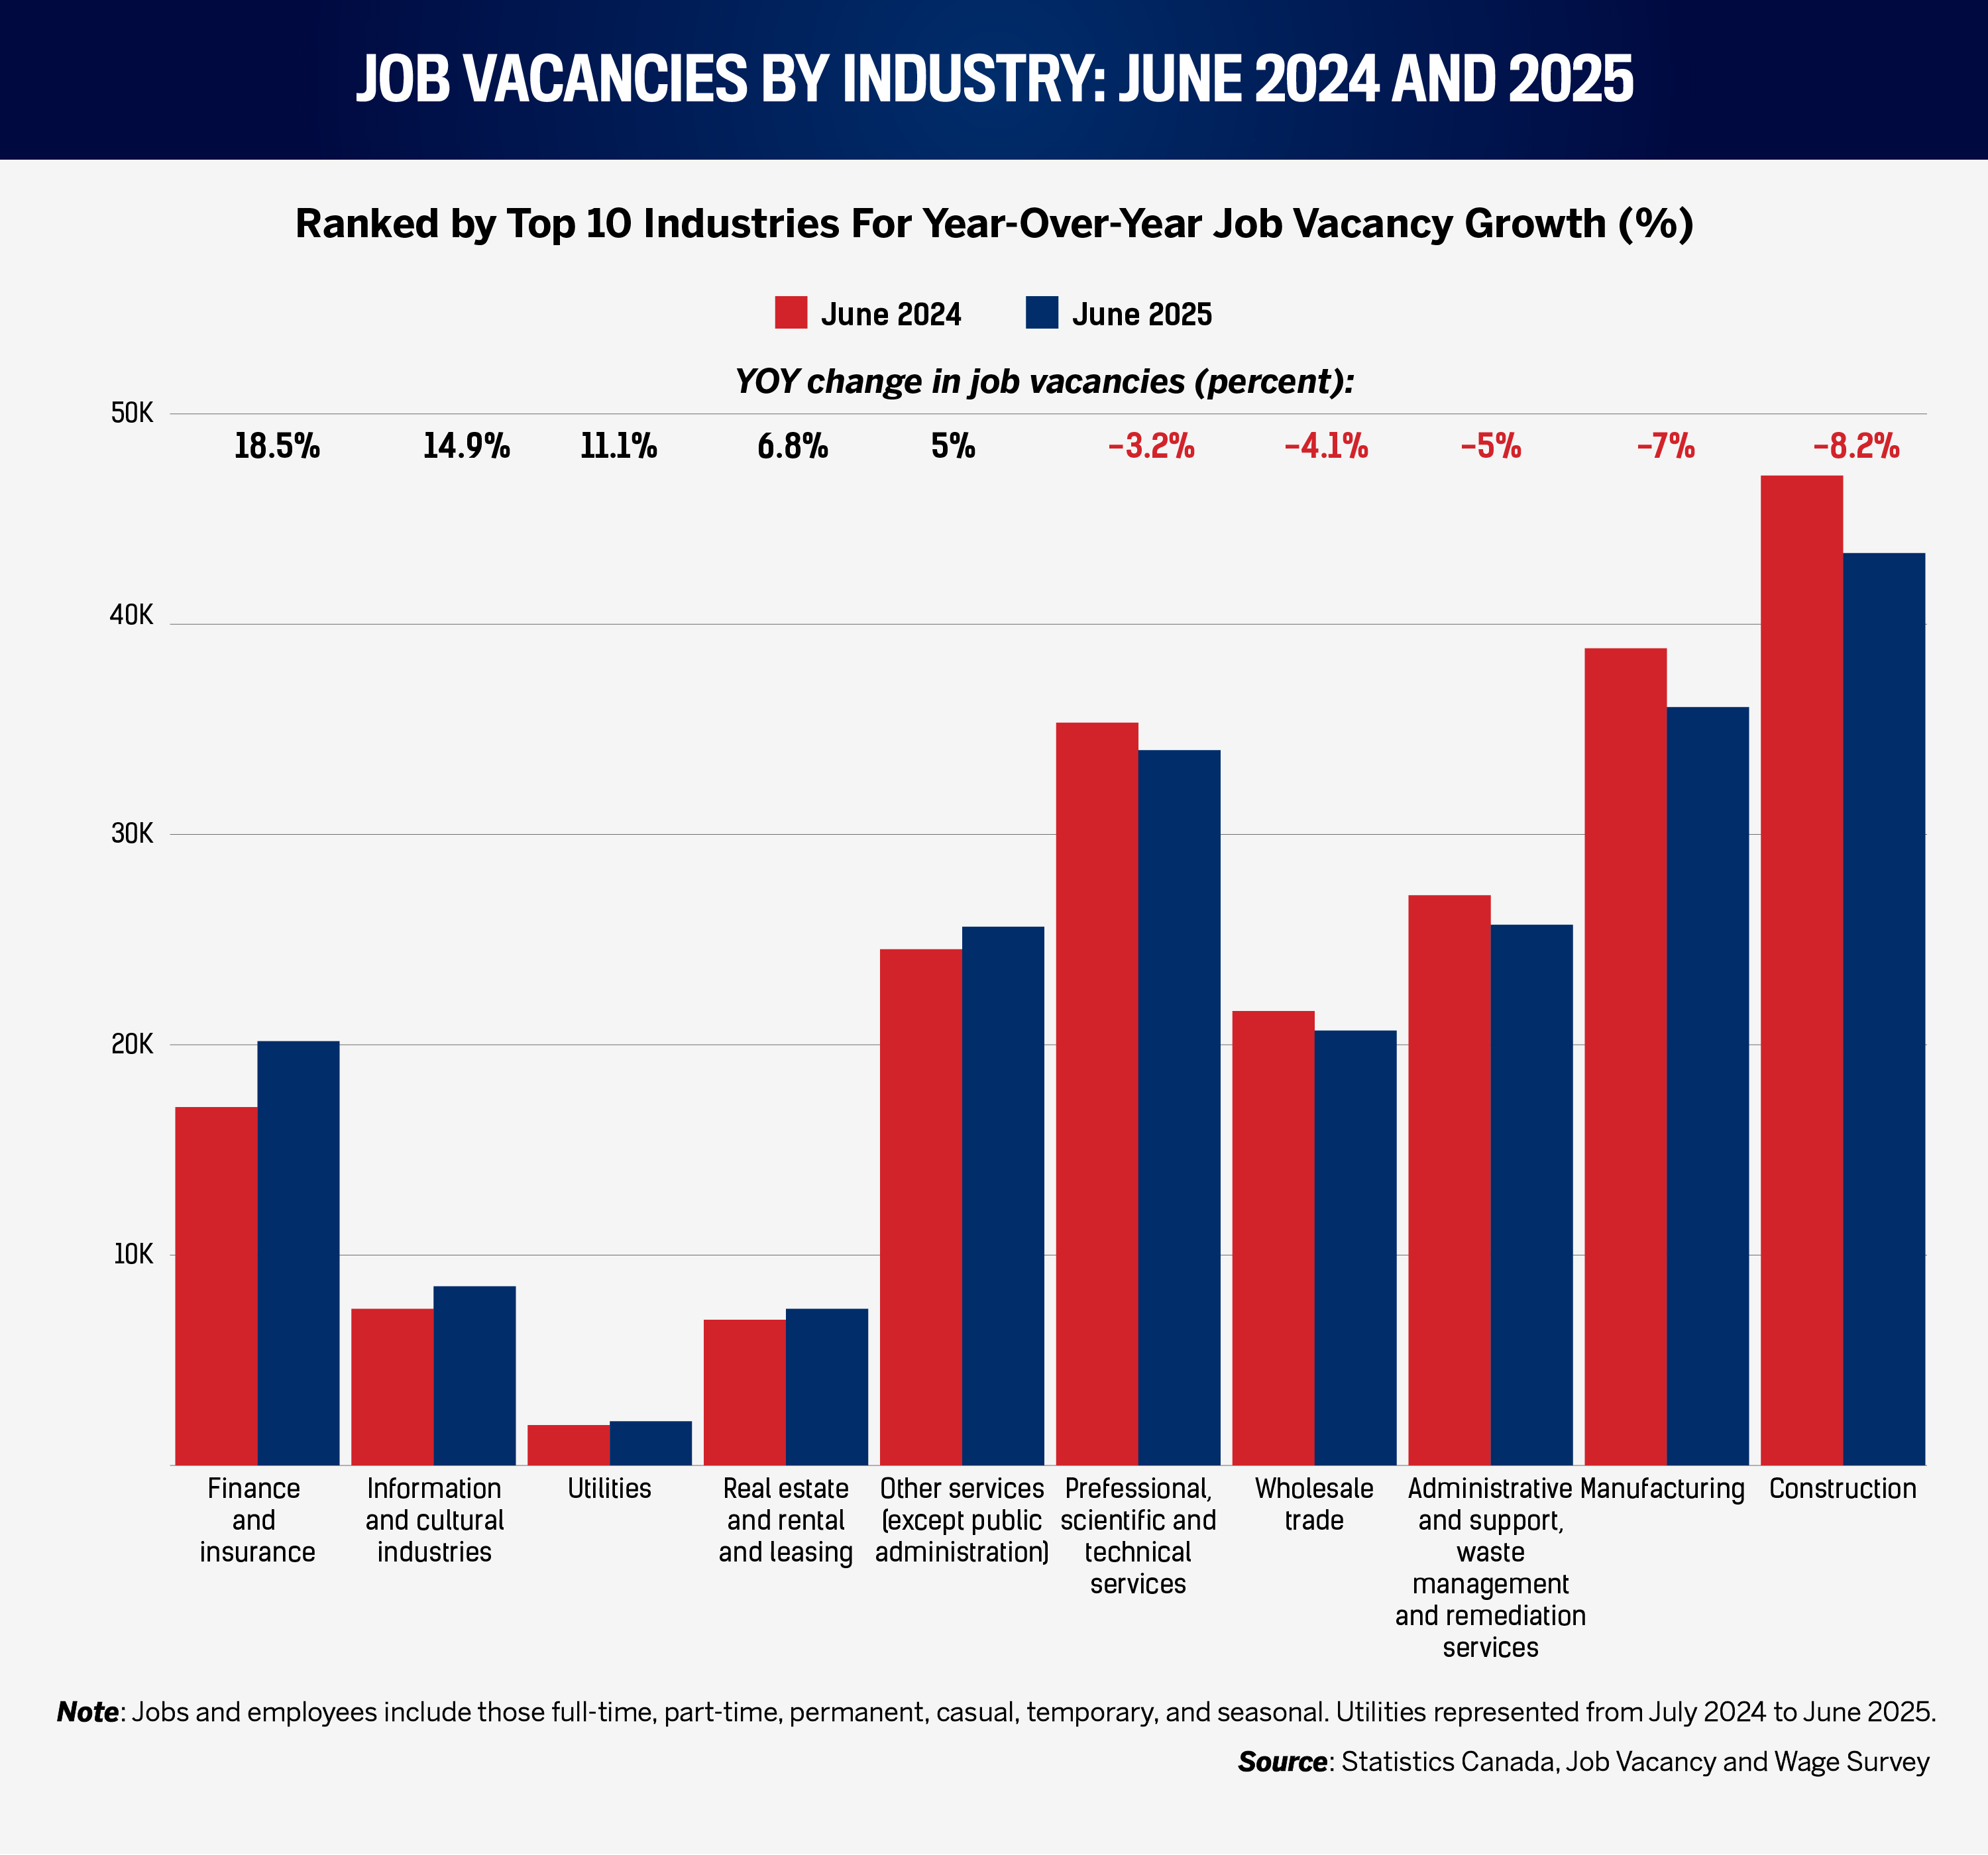
June’s industry breakdown emphasizes the concentration highlighted above. Finance and insurance recorded the fastest vacancy-rate growth (+18.6 percent YoY) with a June rate of 2.3 percent, consistent with continuing demand for risk, capital management, underwriting, and transformation skill sets. Information and cultural industries followed (+14.9 percent YoY; rate 2.4 percent), where competition for content, product, and data talent remains tight and echoed this month’s wage league table. Utilities posted an 11.4 percent YoY gain (rate 1.5 percent), notable given the sector’s typically low churn and high credentialing thresholds. Real estate and rental and leasing (+6.9 percent YoY; rate 2.5 percent) and other services (+5.0 percent YoY; rate 4.3 percent) rounded out the list.
By contrast, vacancy rates fell significantly YoY across a broad swathe of the economy, notably transportation and warehousing (−23.5 percent), management of companies (−21.8 percent), education (−19.6 percent), health care (−20.0 percent), agriculture/forestry/fishing/hunting (−19.3 percent), and accommodation and food services (−10.1 percent). The declines in labour-intensive services suggest that staffing levels have caught up with Canadian demand or that caution in backfilling is holding down posted vacancies. For HR, the tactical takeaway is twofold. First, move fast in the five growth sectors; offers still need to clear the market to land specialist talent. Second, where vacancy rates are falling, resist the temptation to compress pay too aggressively; some easing reflects deliberate pacing rather than weak demand, and over-correction risks reopening hard-won roles later in the year.
Wages vs. inflation: median wages rise faster than inflation, bringing real wages above cost increases for the first time in months
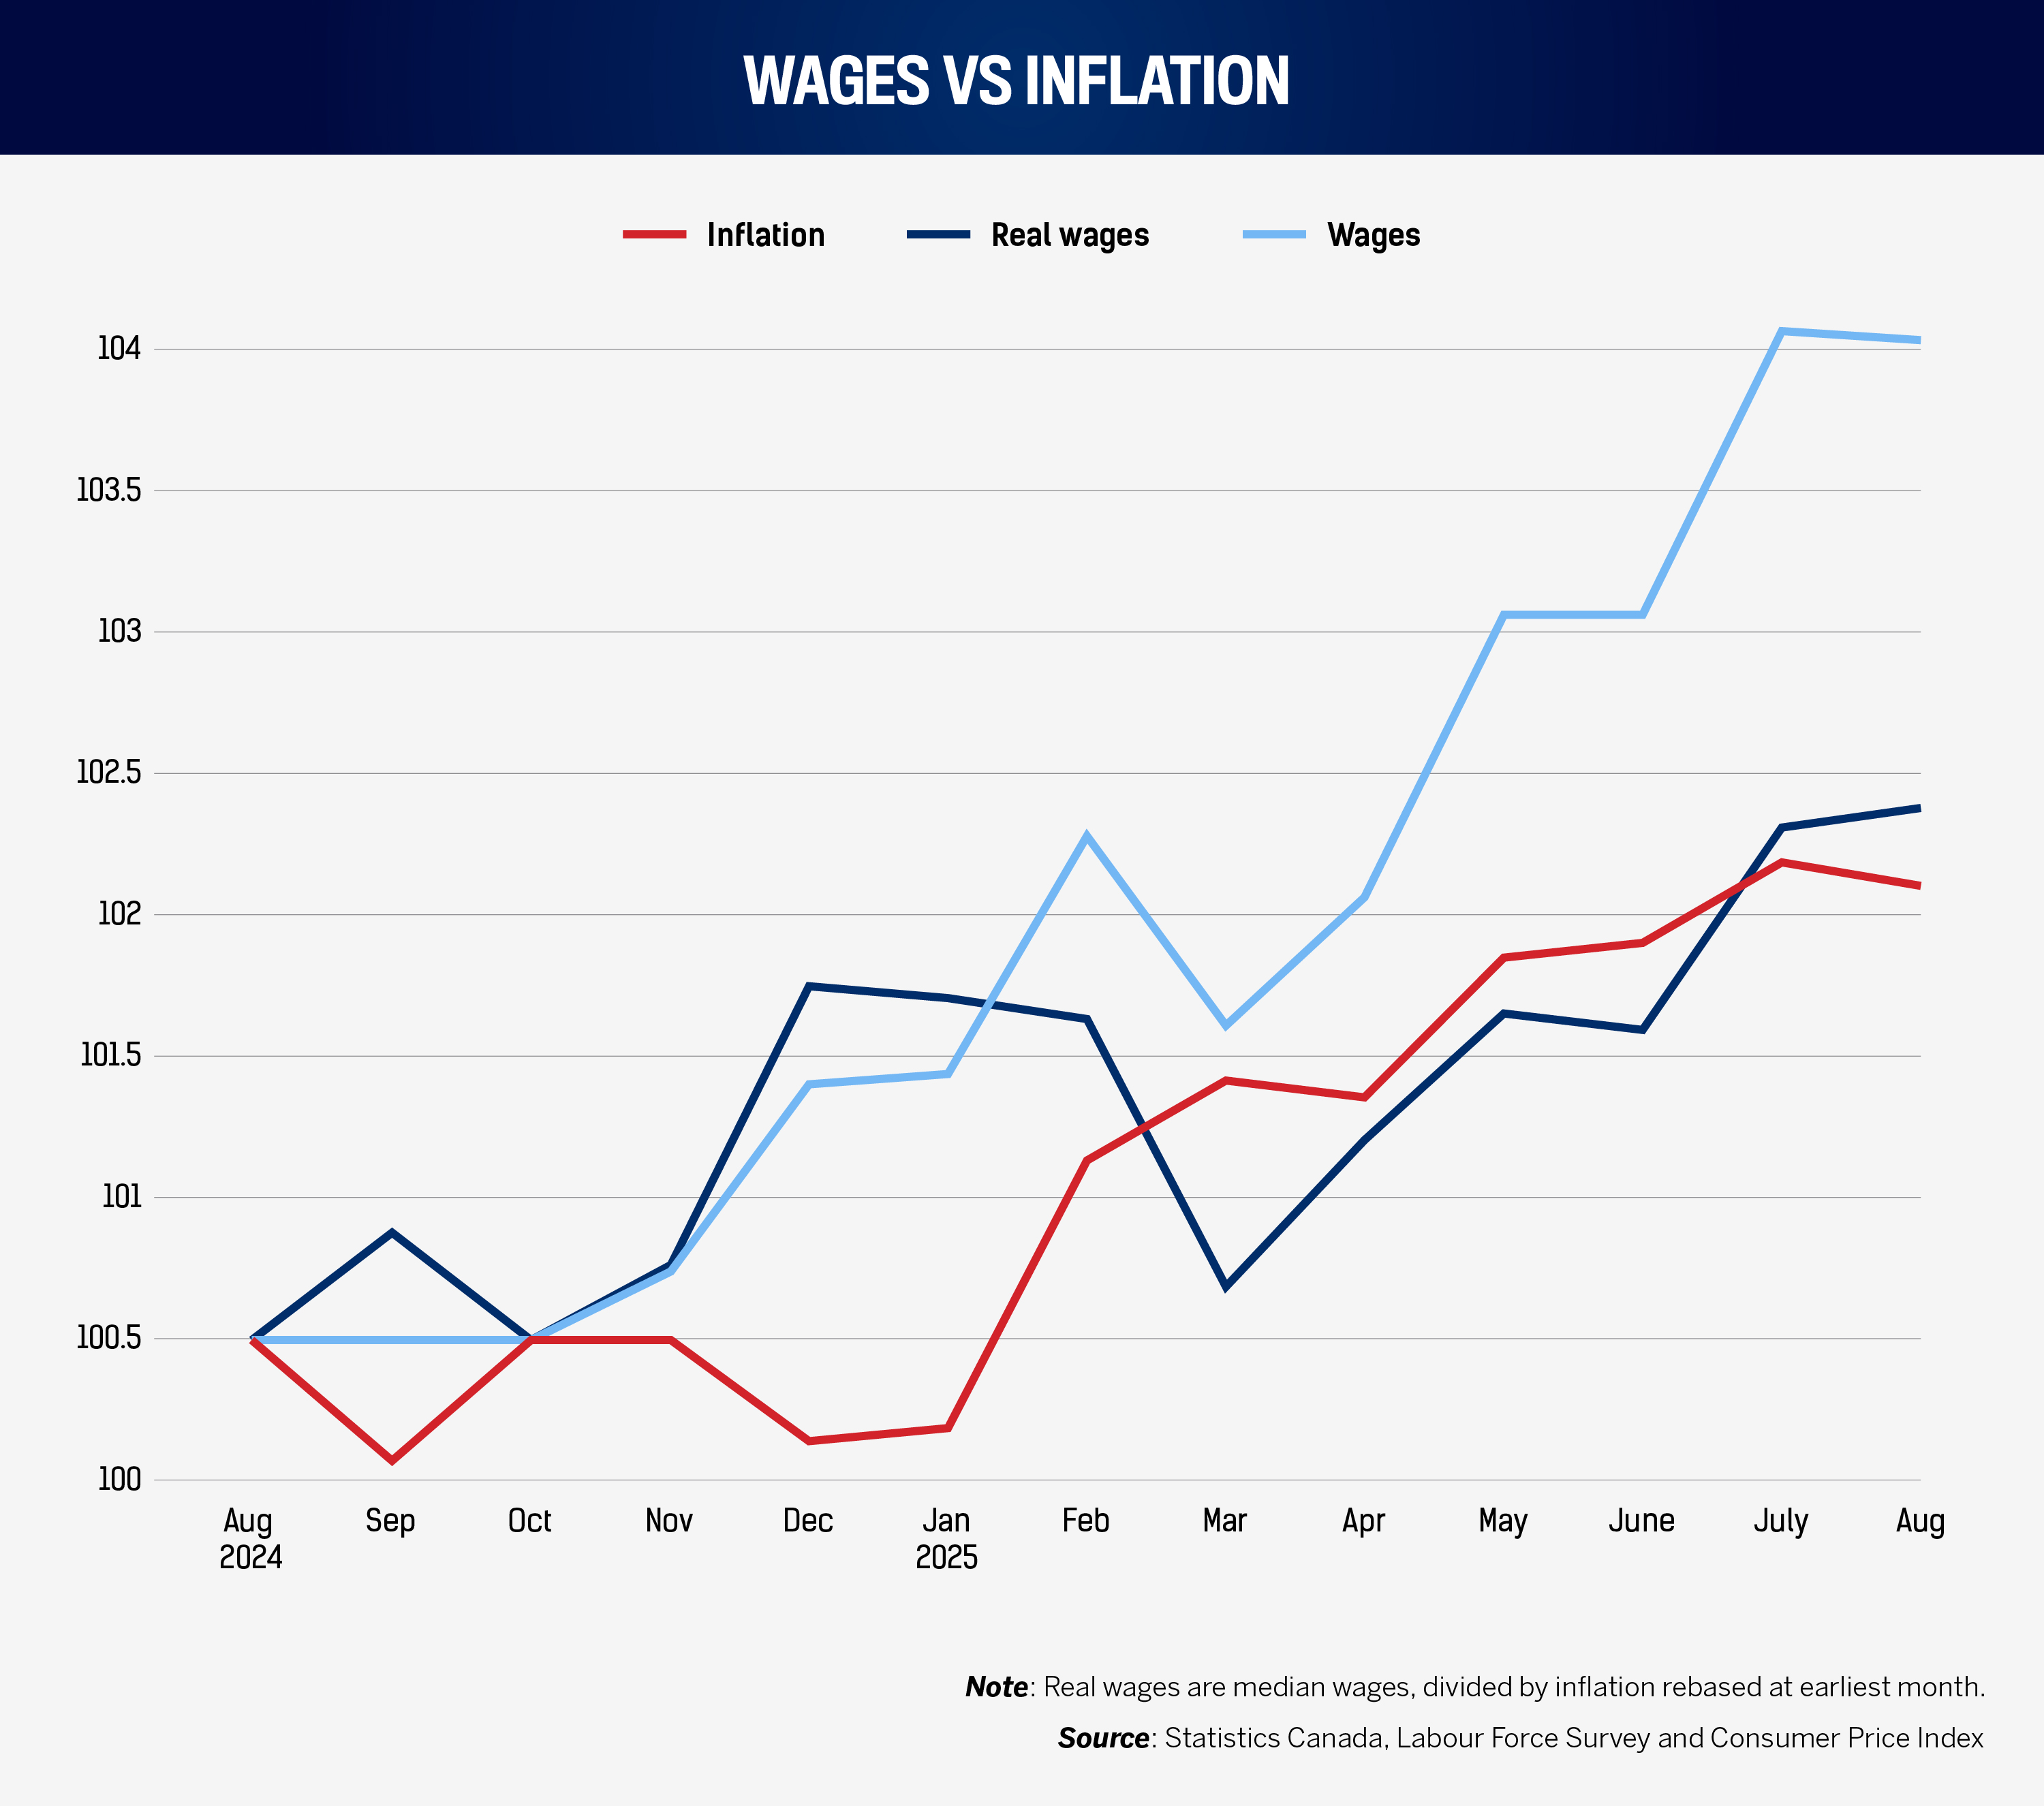
Pay continued to pull ahead of prices in August. Median hourly wages reached $35, up from $33.64 in August 2024 (+$1.36; +4.0 percent). Over the same period, the CPI index rose from 161.8 to 164.8 (roughly +1.9 percent), leaving a gap in employees’ purchasing power of about sixty cents at the median. Those real gains arrive just as unemployment among core-age workers jumped (6.92 percent in August; see below), an unusual pairing that HR teams will need to navigate carefully: candidates will reference peers’ wage improvements, even as competition for roles intensifies.
Two practical points follow. First, the wage–price arithmetic means that sub-3 percent offers will likely be perceived as a step back in real terms; where budgets constrain base pay, use targeted instruments: sign-on awards for hard-to-fill roles, accelerated progression for critical skills, and benefits that reduce out-of-pocket costs (health and commuting). Second, the sectoral distribution of tightness matters. Real wage headroom is being absorbed fastest where vacancy-rate growth remains positive (finance, information and culture, and utilities; see above). Matching pay to market in those pockets reduces re-posting risk and protects delivery timetables on transformation work.
Industry-specific wages: top wage increases YoY mirror few industries with increased availability
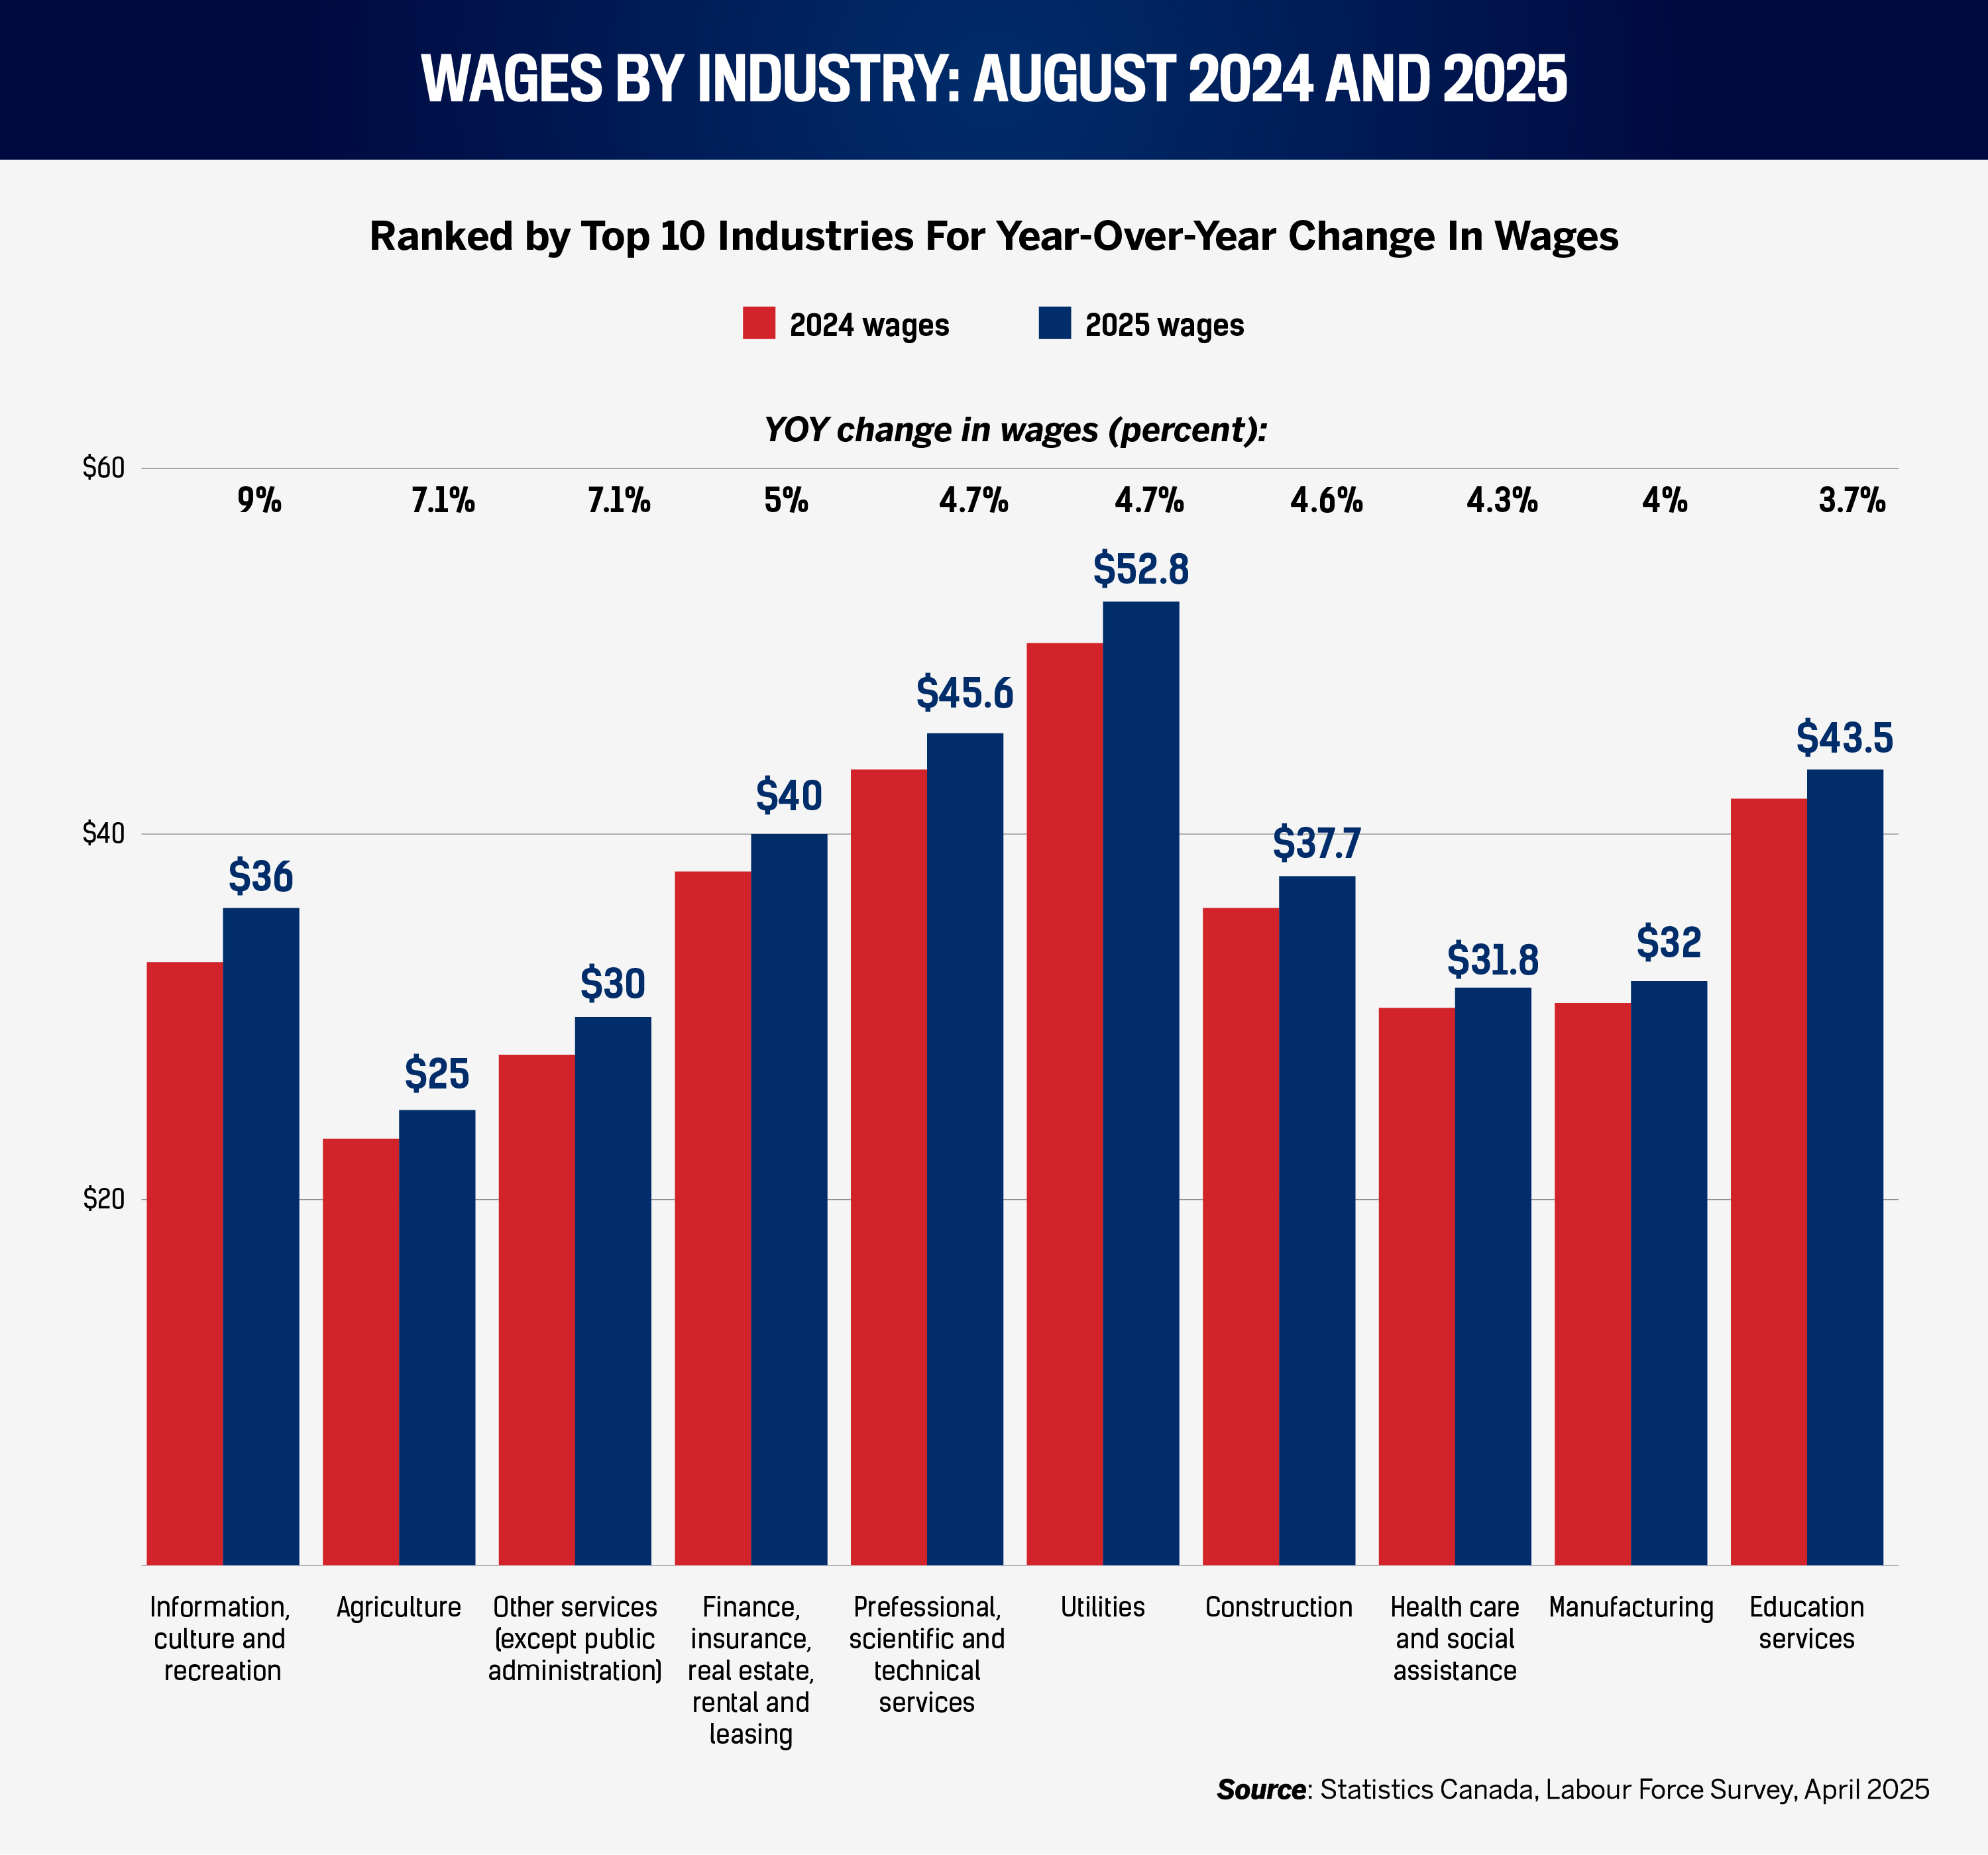
Sectoral wage dynamics remain decisive. Information, culture, and recreation continues its lead throughout the year (+9.1 percent YoY to $36.00), reflecting persistent competition for content, product, and digital roles that increasingly overlap with technology. Agriculture’s +7.2 percent rise (to $25) underscores the ongoing professionalization of farm-gate and processing roles, where compliance, traceability, and technology adoption require more stable staffing models. “Other services” (personal care, civic, repair) rose 7.1 percent to $30, an indicator that small-enterprise labour markets remain tight where services are face to face and scheduling complexity is high.
The professional and capital-heavy end of the economy shows steady, if less spectacular, growth. Finance/insurance/real estate/leasing (+5 percent to $40.00), professional, scientific, and technical (+4.8 percent to $45.67), and utilities (+4.8 percent to $52.88) add to the picture of sustained demand for credentialed expertise and risk/governance capacity. Construction’s +4.7 percent to $37.75 is noteworthy given its fewer vacancies (see above) and shorter tenure (below): retention now hinges as much on safety, predictable rosters, and foreperson development as on base pay.
Unlike the previous editions, this month saw higher-paying roles leading wage growth, including those in information and culture, finance, insurance, rental and leasing, and professional, scientific, and technical services.
Industry gender wage gaps: utilities flip toward parity, and many reverse the male-female wage gap in a relatively subdued month for YoY gap increases
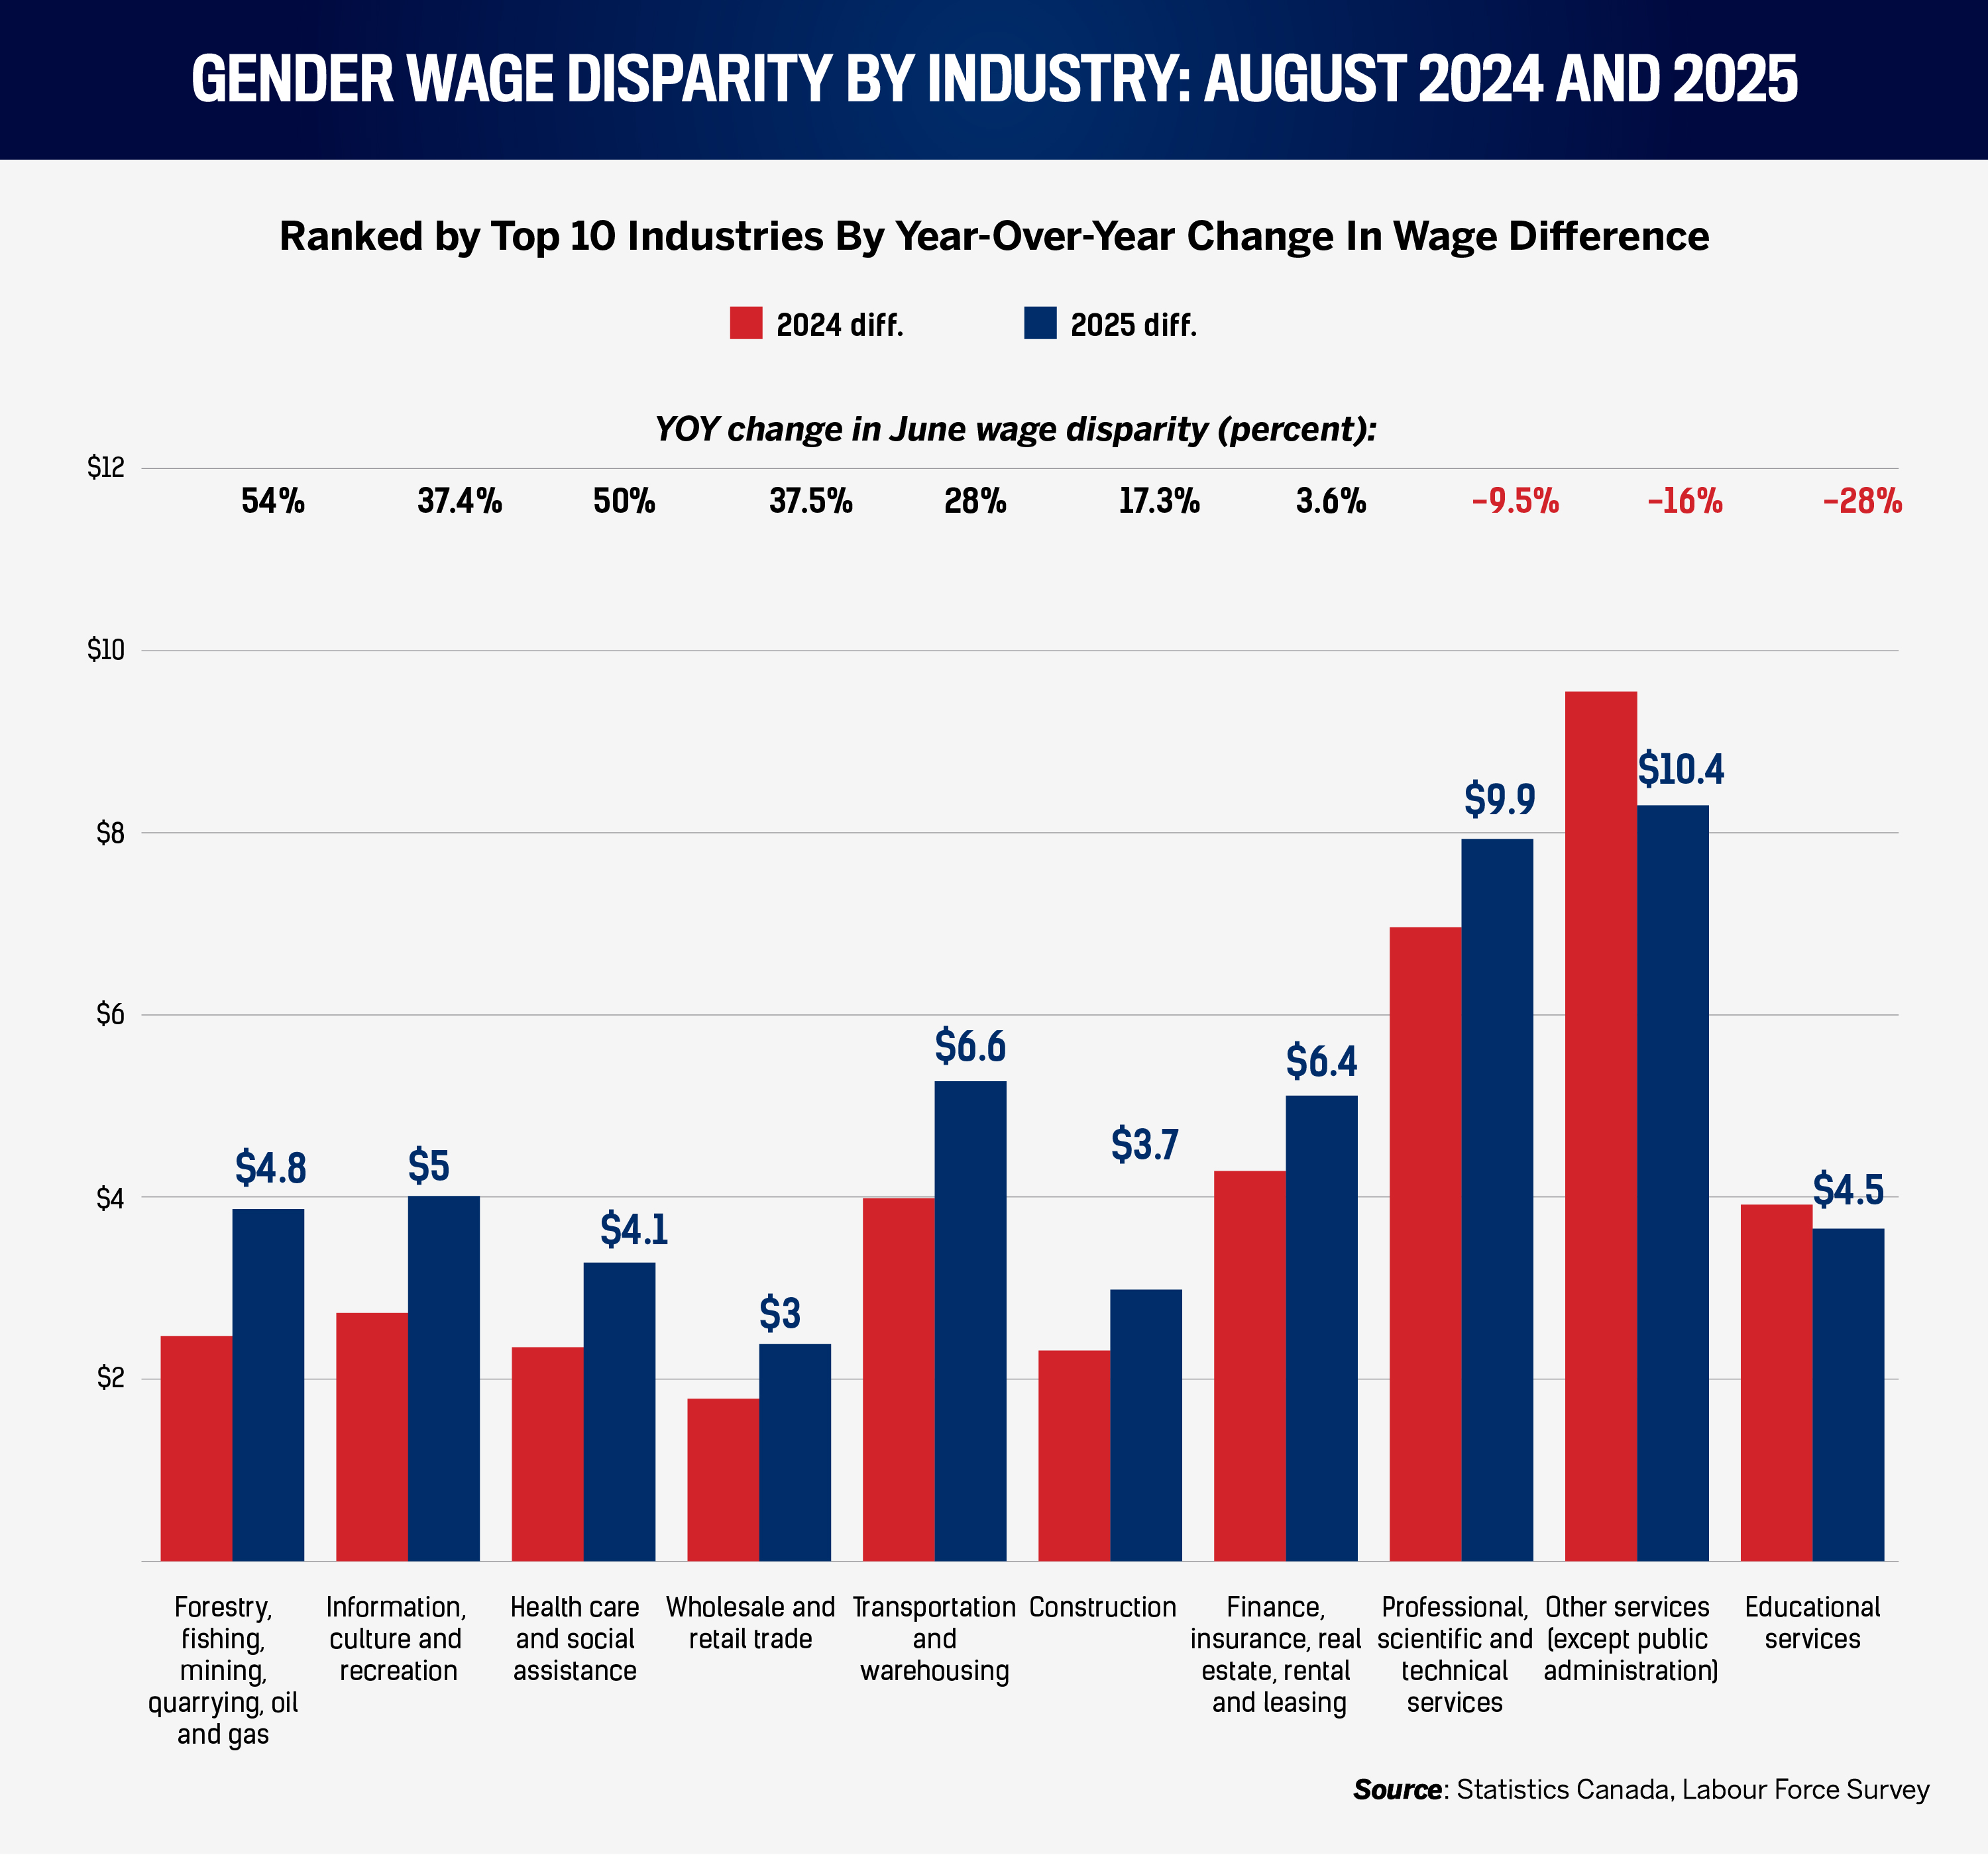
Pay equity risk is again moving in the wrong direction in several large employing sectors. However, the YoY changes were much more subdued in August compared to more troubling spikes in previous editions of this report. This month, the YoY acceleration was stark in information, culture, and recreation: the male–female median gap widened by $1.70 to $4.84 (+54.1 percent YoY), notable as the sector led overall wage growth. Wholesale and retail posted a $1.61 widening to $5.05 (+46.8 percent). Utilities’ gap remarkably inverted this August; women earn more than men at the median. However, the differential moved closer to parity (from −$2.88 to −$1.70), a 41.0 percent increase in the male–female differential. Agriculture (+$1.15 to $4.15; +38.3 percent) and manufacturing (+$0.75 to $3.00; +33.3 percent) round out the biggest movers.
Three takeaways matter for HR. First, widening gaps are not limited to one end of the pay scale; they appear both in customer-facing, lower-paid sectors and in the higher-paid, credential-heavy utilities and finance segments. Second, fast wage growth can mask divergence if one cohort benefits more from promotions into higher-paid roles. Third, the sectors that buck the trend demonstrate that governance and role architecture can steer outcomes even in tight markets. Before year-end compensation decisions, conduct cohort-by-cohort equity reviews at the job-family level, ensure promotion and project assignment criteria are documented and applied consistently, and publish internal dashboards that make progress visible.
Tenure: wage-growing industries fail to stop falling retention
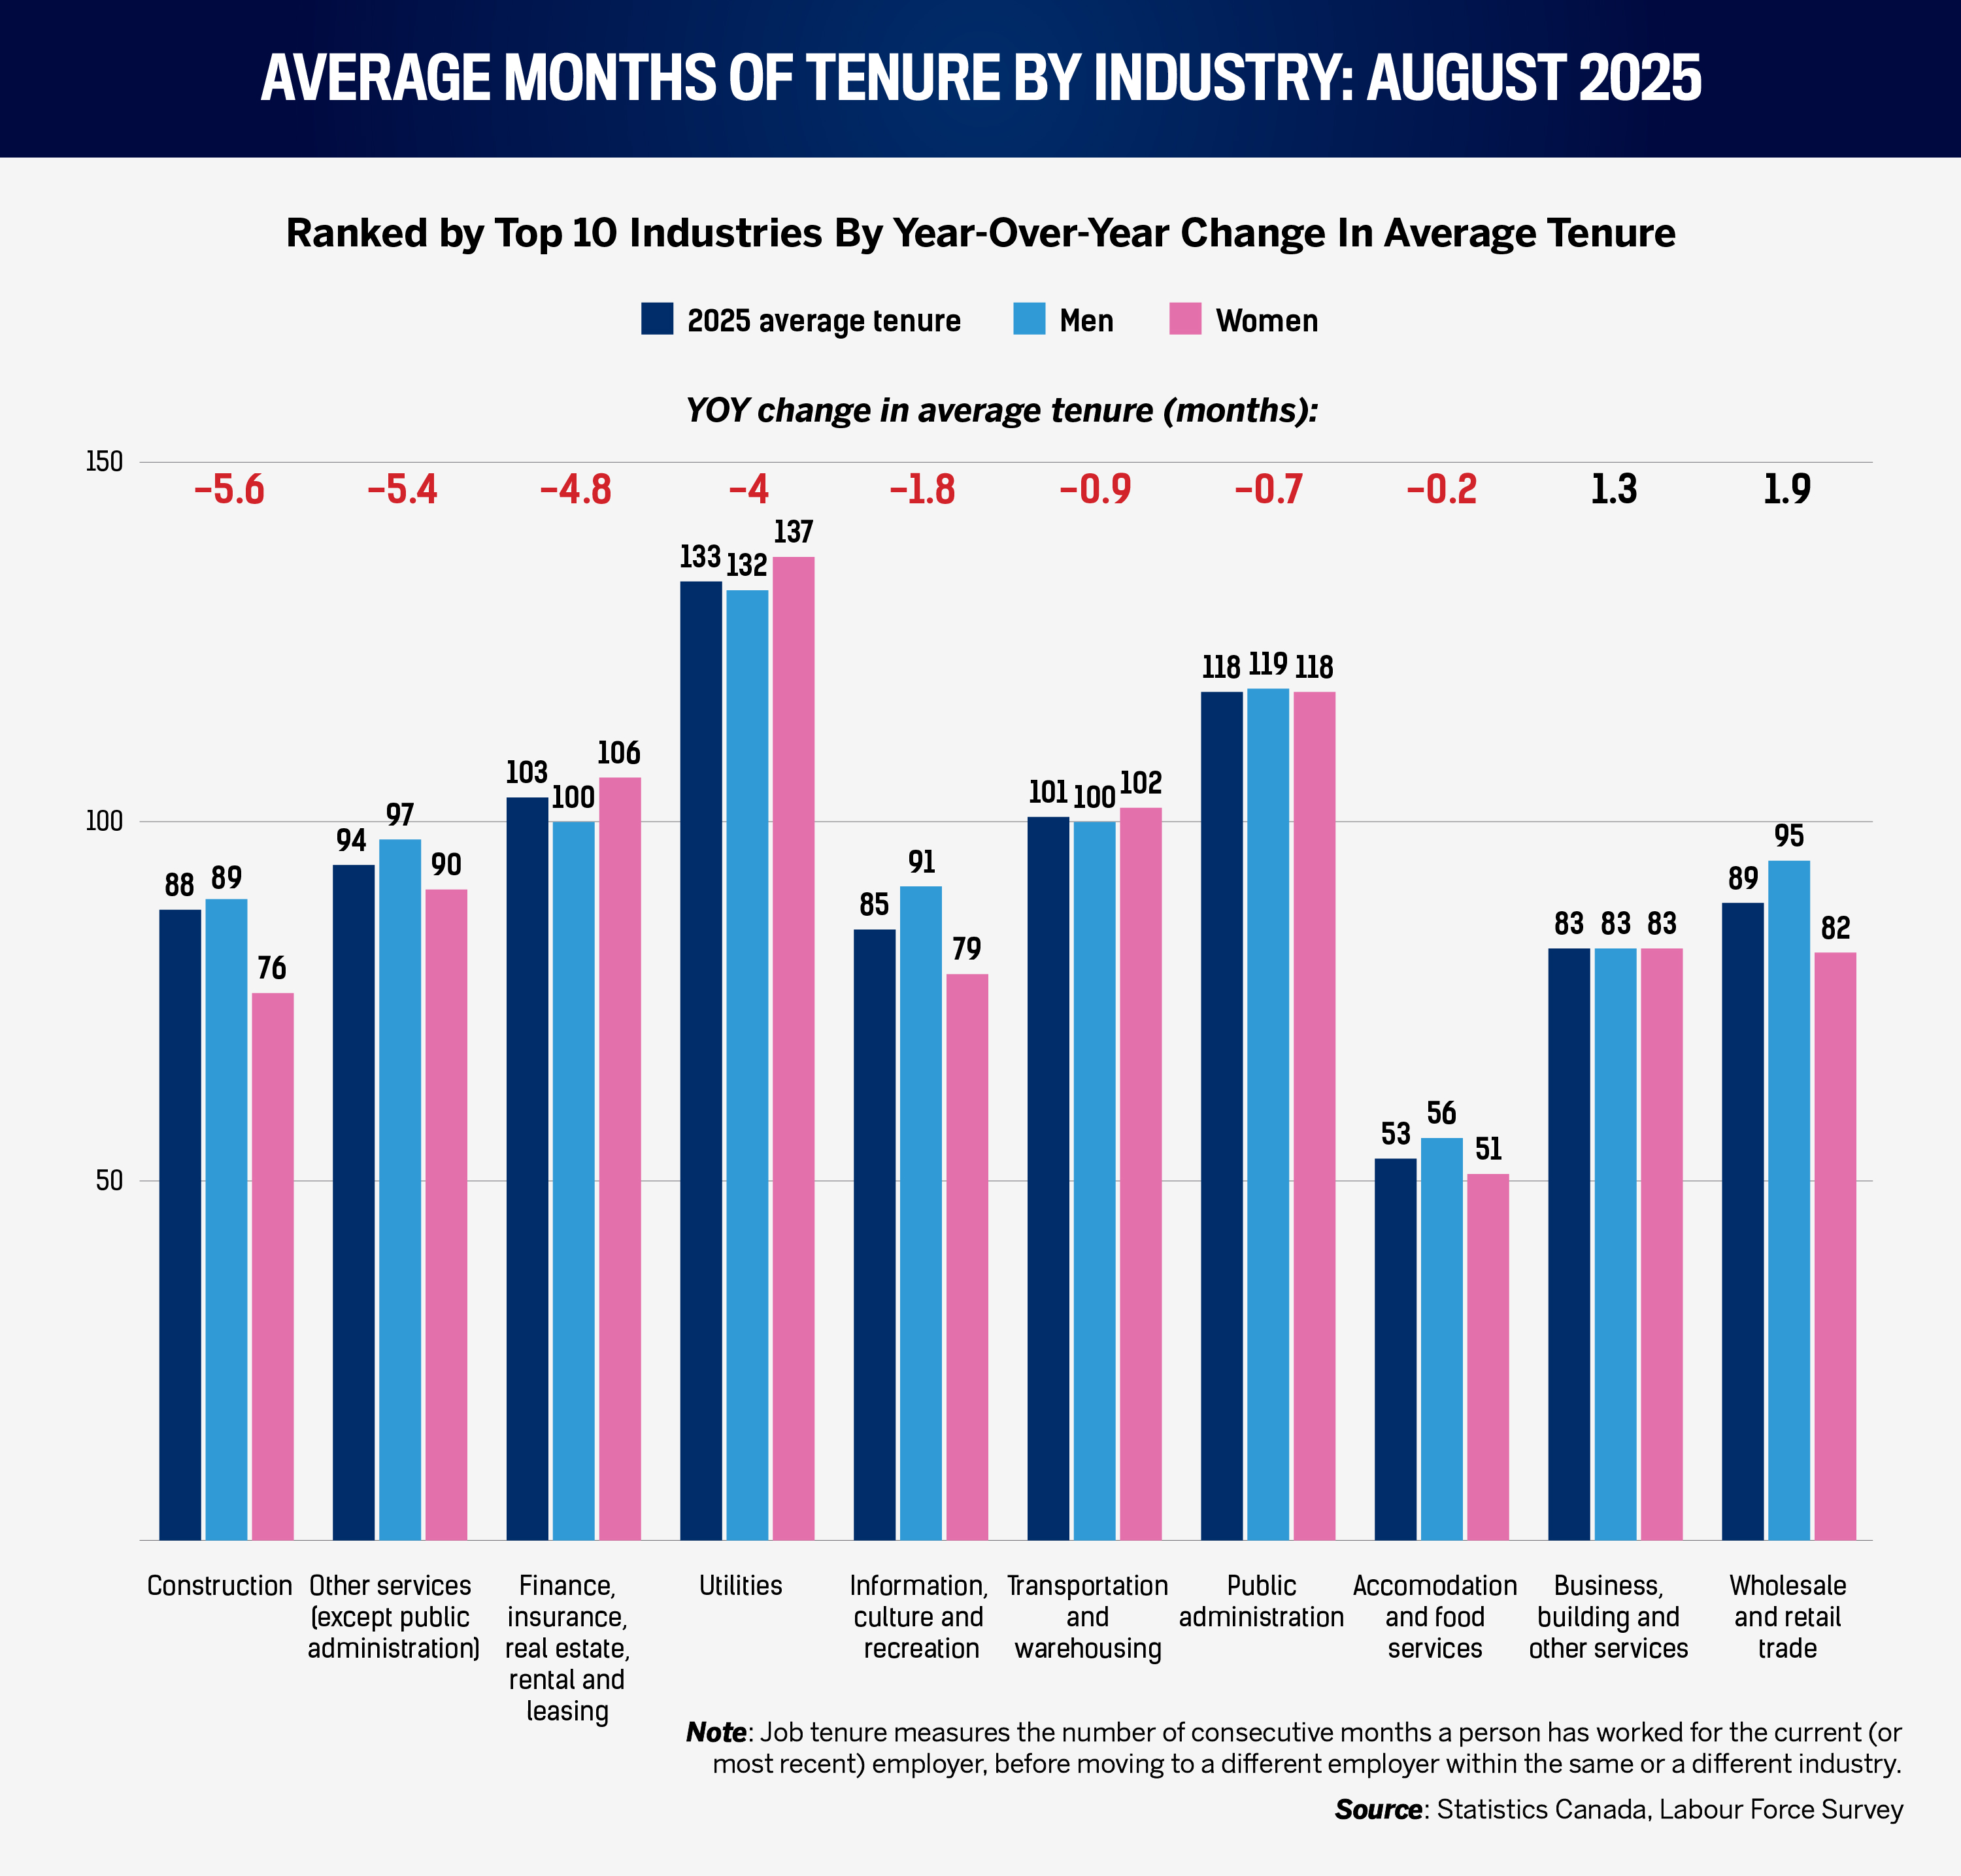
Tenure is a sensitive barometer for organizational health, and August’s readings vary across industries. Construction posted the sharpest YoY drop (−5.6 months to 87.6), underlining the stress of compressed timelines, subcontracting complexity, and cyclical funding. Other services fell by 5.4 months to 93.8, finance/insurance/real estate/leasing by 4.8 to 103.2, and utilities by 4.0 to 133.2. These declines indicate that base pay increases (noted above) are necessary but insufficient when rostering volatility, safety risk, or change fatigue is high.
Information, culture, and recreation (−1.8 months) and transportation and warehousing (−0.9) also shortened, likely reflecting active job-shopping in sectors with above-average wage movement and vacancy changes. Public administration’s modest decline (−0.7) is directionally small but worth watching given the sector’s reliance on predictable progression to anchor retention. Accommodation and food fell slightly (−0.2), showing that tenure stabilization earlier in the year has not reversed but does remain fragile.
Tenure improved in agriculture (+3.0 months to 176.7) and business support services (+1.3 to 82.7), where gains likely reflect clearer job architecture and steadier seasonality. Across sectors with declines, HR’s highest-return levers are not purely financial: implement predictable shift patterns, invest in front-line supervisor capability (coaching, conflict resolution), and build short, credible internal pathways that move high-performers into stable roles within 12–18 months. Tie these to safety and quality metrics to demonstrate that retention pays for itself.
Litigation: Ontario Labour Board caseload continues to surge, led by construction disputes
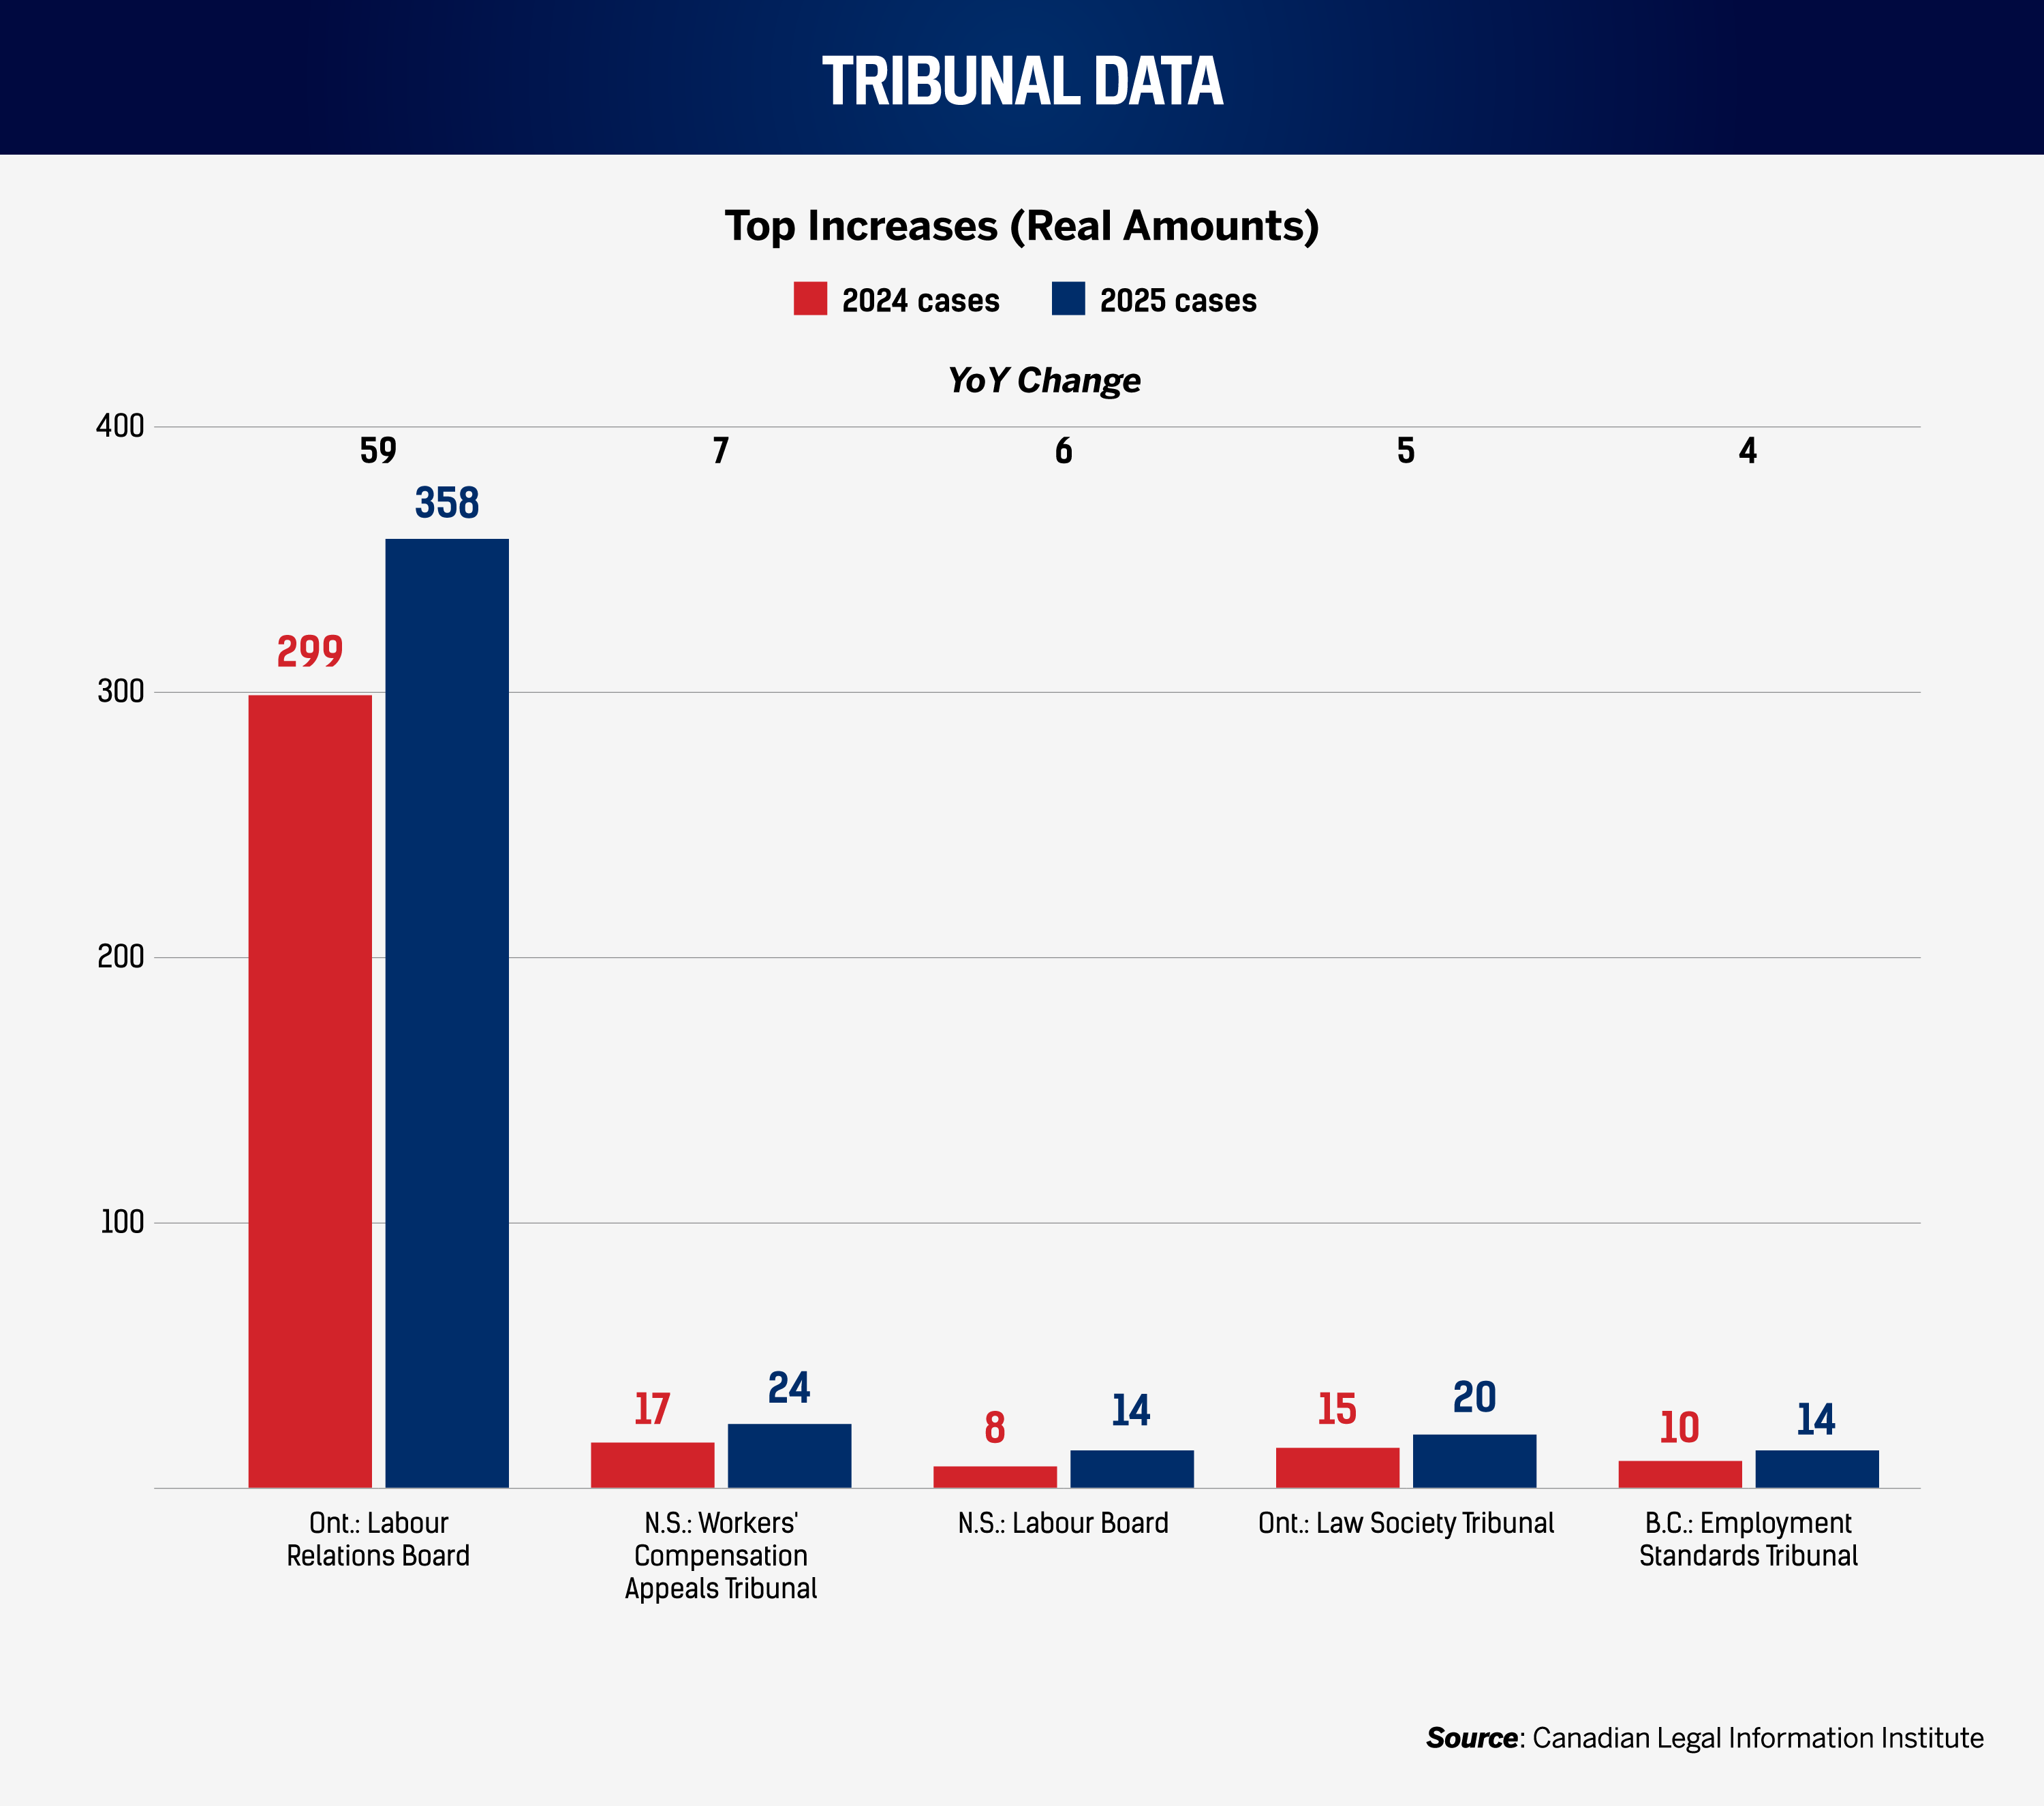
Ontario Labour Relations Board decisions rose by 59 compared with a year earlier, cementing the Board’s position as the country’s most active labour forum. Case descriptions this month show familiar patterns in construction, i.e., disputes over jurisdiction and subtrades, timeliness of certification applications, and allegations of unfair labour practices in organizing campaigns, alongside complaints about employer interference and duty-to-bargain allegations. In other words, structural tightness and project complexity continue to spill into formal dispute channels. HR leaders in construction and construction-adjacent sectors should ensure site-level supervisors are trained to recognize certification activity, escalate promptly, and avoid statements or actions that can be characterized as interference; review subcontractor onboarding to confirm your policies bind contractors in the same way they bind employees.
Nova Scotia’s Workers’ Compensation Appeals Tribunal posted a seven-case increase YoY. The month’s decisions commonly turned on causation (e.g., whether chronic or degenerative conditions were work-related), the sufficiency of medical evidence, ratings of permanent impairment, and the appropriateness of modified duties. For employers in all provinces, the risk controls are the same: early contact, clear functional abilities forms, and contemporaneous documentation of offers of accommodation. Nova Scotia’s Labour Board also recorded a six-case increase, with matters ranging from bargaining unit scope to certification disputes and again signalling that basic union-relations governance (timely information, neutral communications, and issue logs) is as much a retention tool as a legal necessity.
Two additional jurisdictions bear watching. The Ontario Law Society Tribunal (+5) reminds legal and compliance functions that professional-conduct standards, including those around harassment, conflicts, and trust accounting, continue to tighten; legal employers should not assume internal policies are a ceiling. British Columbia’s Employment Standards Tribunal (+4) underscores that wage, scheduling, and leave entitlements remain a live compliance risk in variable-hours and seasonal teams within the province.
National workforce trends: expanding labour pool concerning amid job vacancies
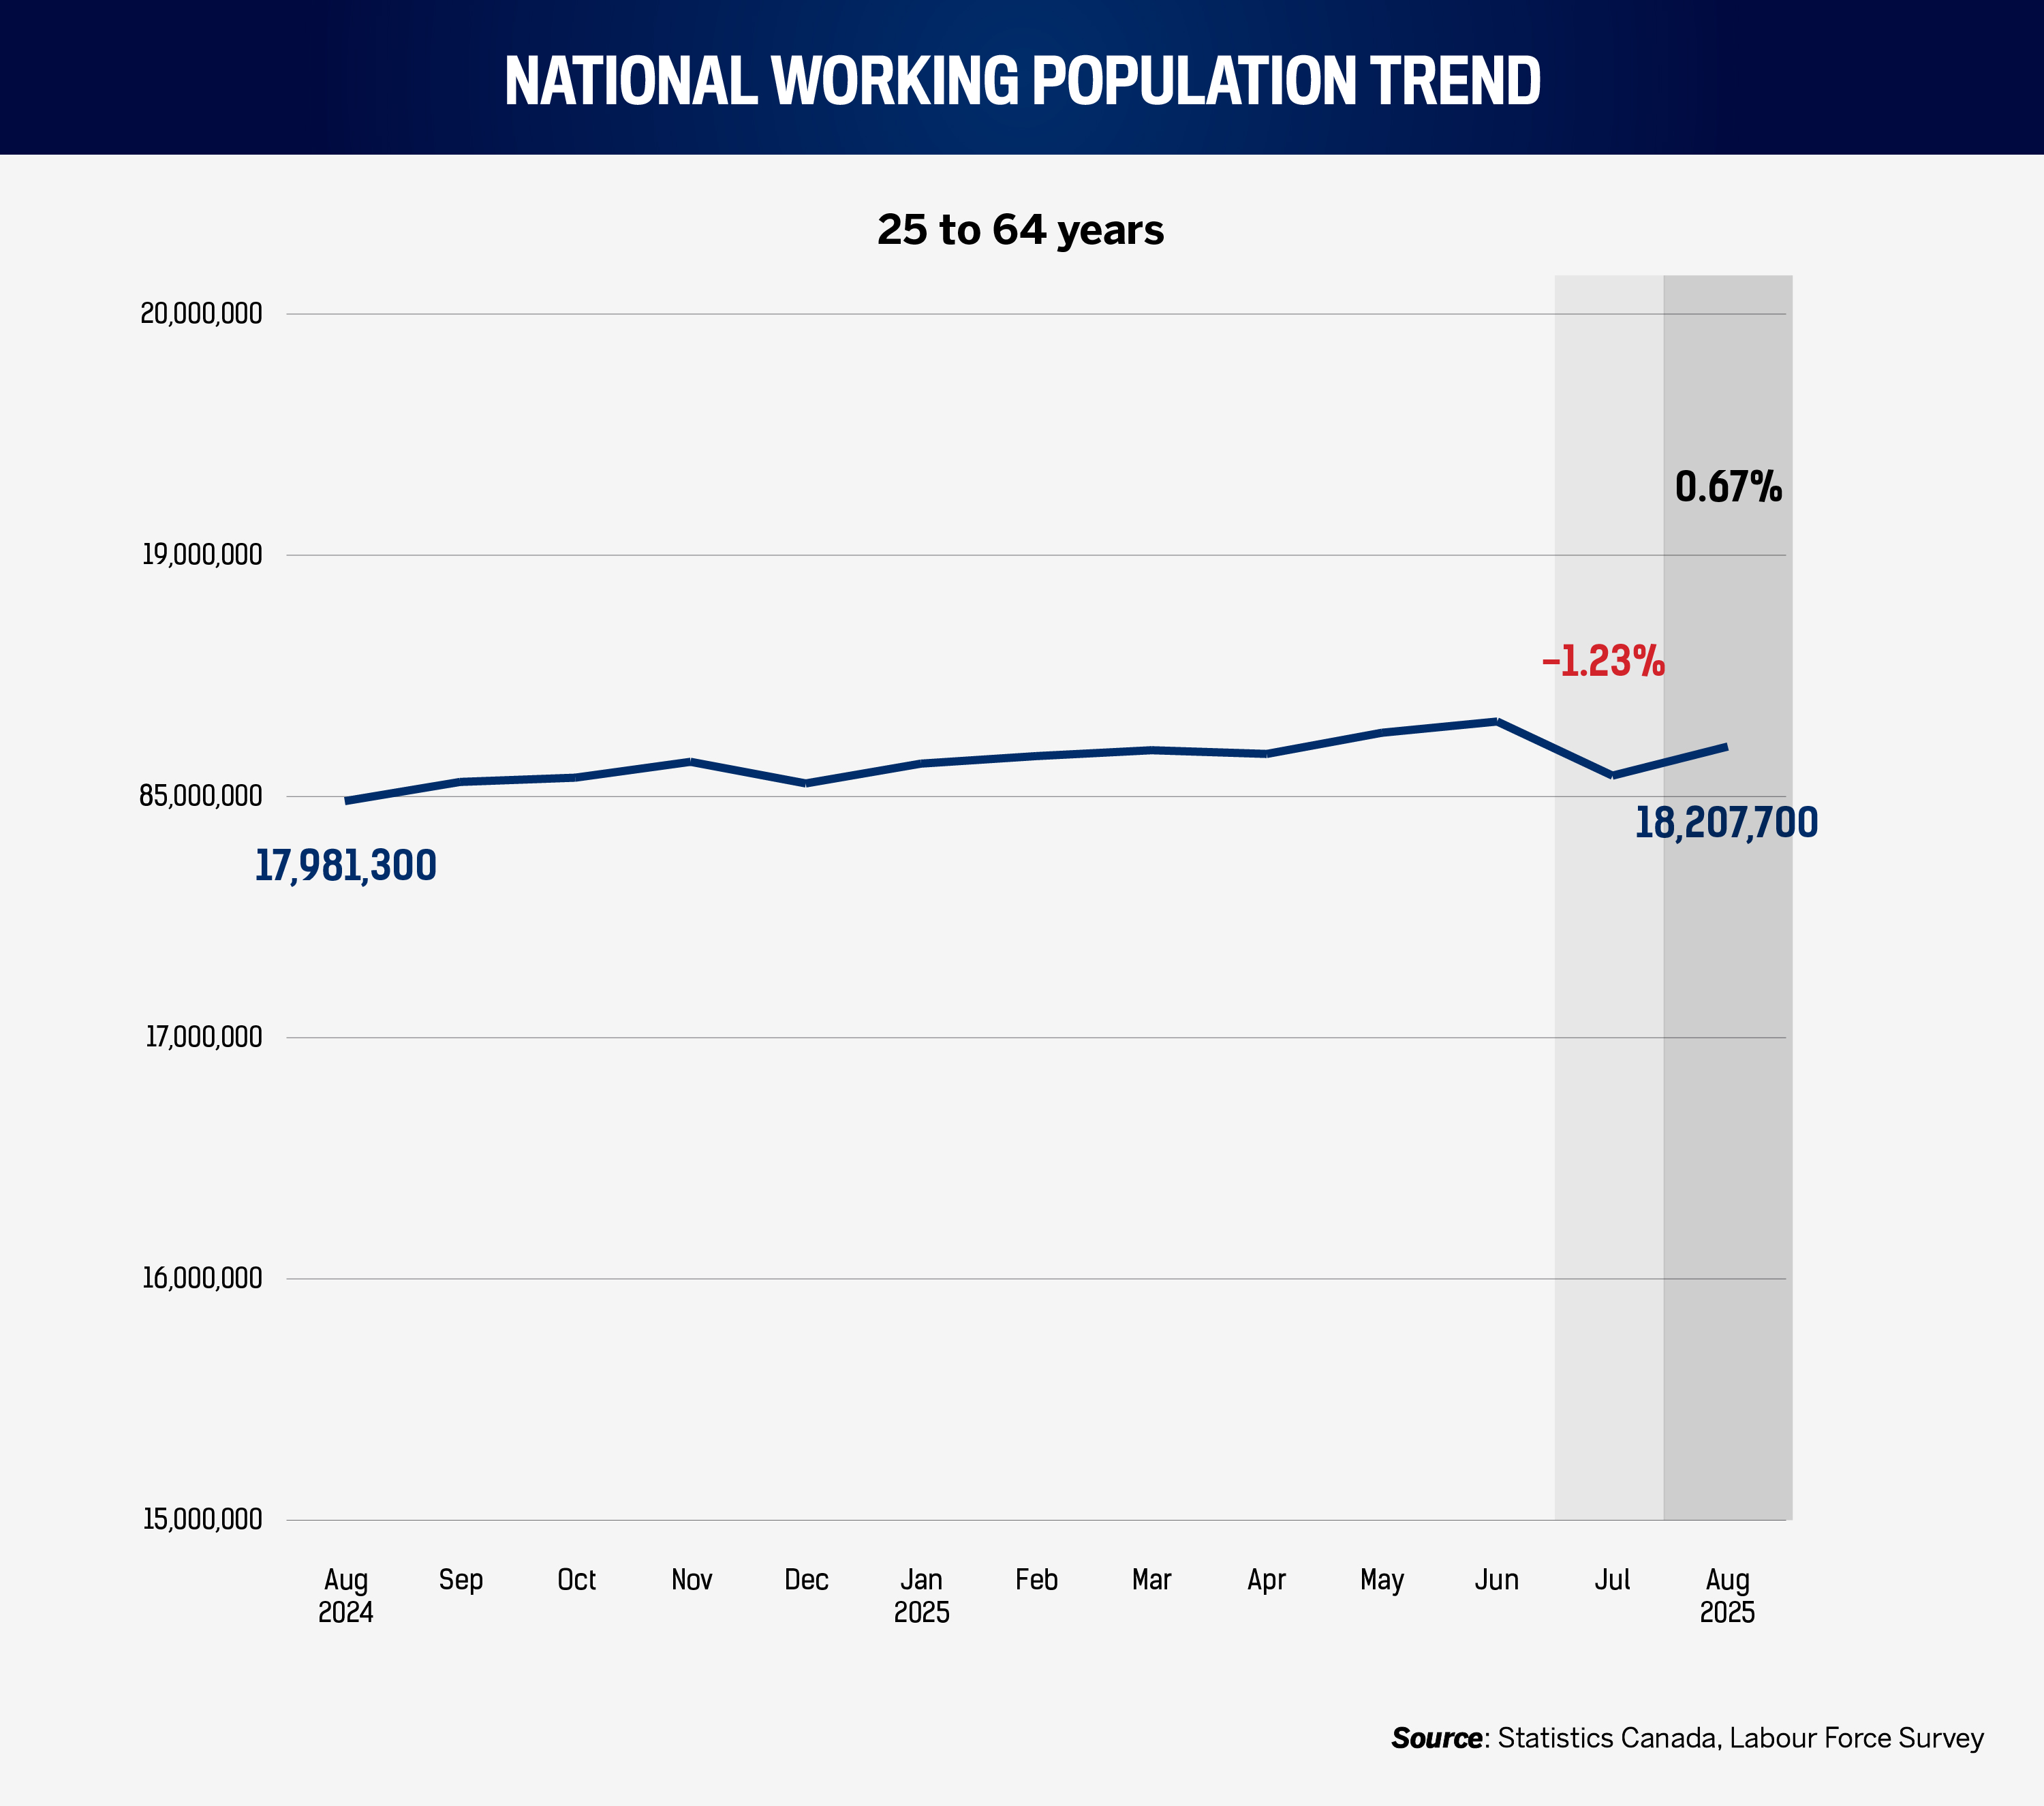
The labour pool expanded materially in August after a softer July. Core-age population reached 18.21 million, +226,400 YoY and +120,700 MoM. That growth, combined with June’s national easing in vacancy rates and higher payroll employment, suggests hiring channels have reopened versus early spring. Yet the sector maps matter more than the averages: finance, utilities, and information and culture will continue to bid for specific talent, while transportation, management companies, and health care show fewer open posts.
For HR, the priority is matching. Improved volumes of applicants mean more shots on goal, but success depends on assessment models that recognize adjacent experience (e.g., manufacturing technicians into grid modernization roles; retail team leads into site-based construction coordination). Deploy short, skill-screening tasks and structured interviews to increase fit; align learning budgets with the top two pathways you can realistically support in-house over 6–12 months.
Provincial and city workforce changes: Alberta leads growth, and Quebec and Ontario add scale
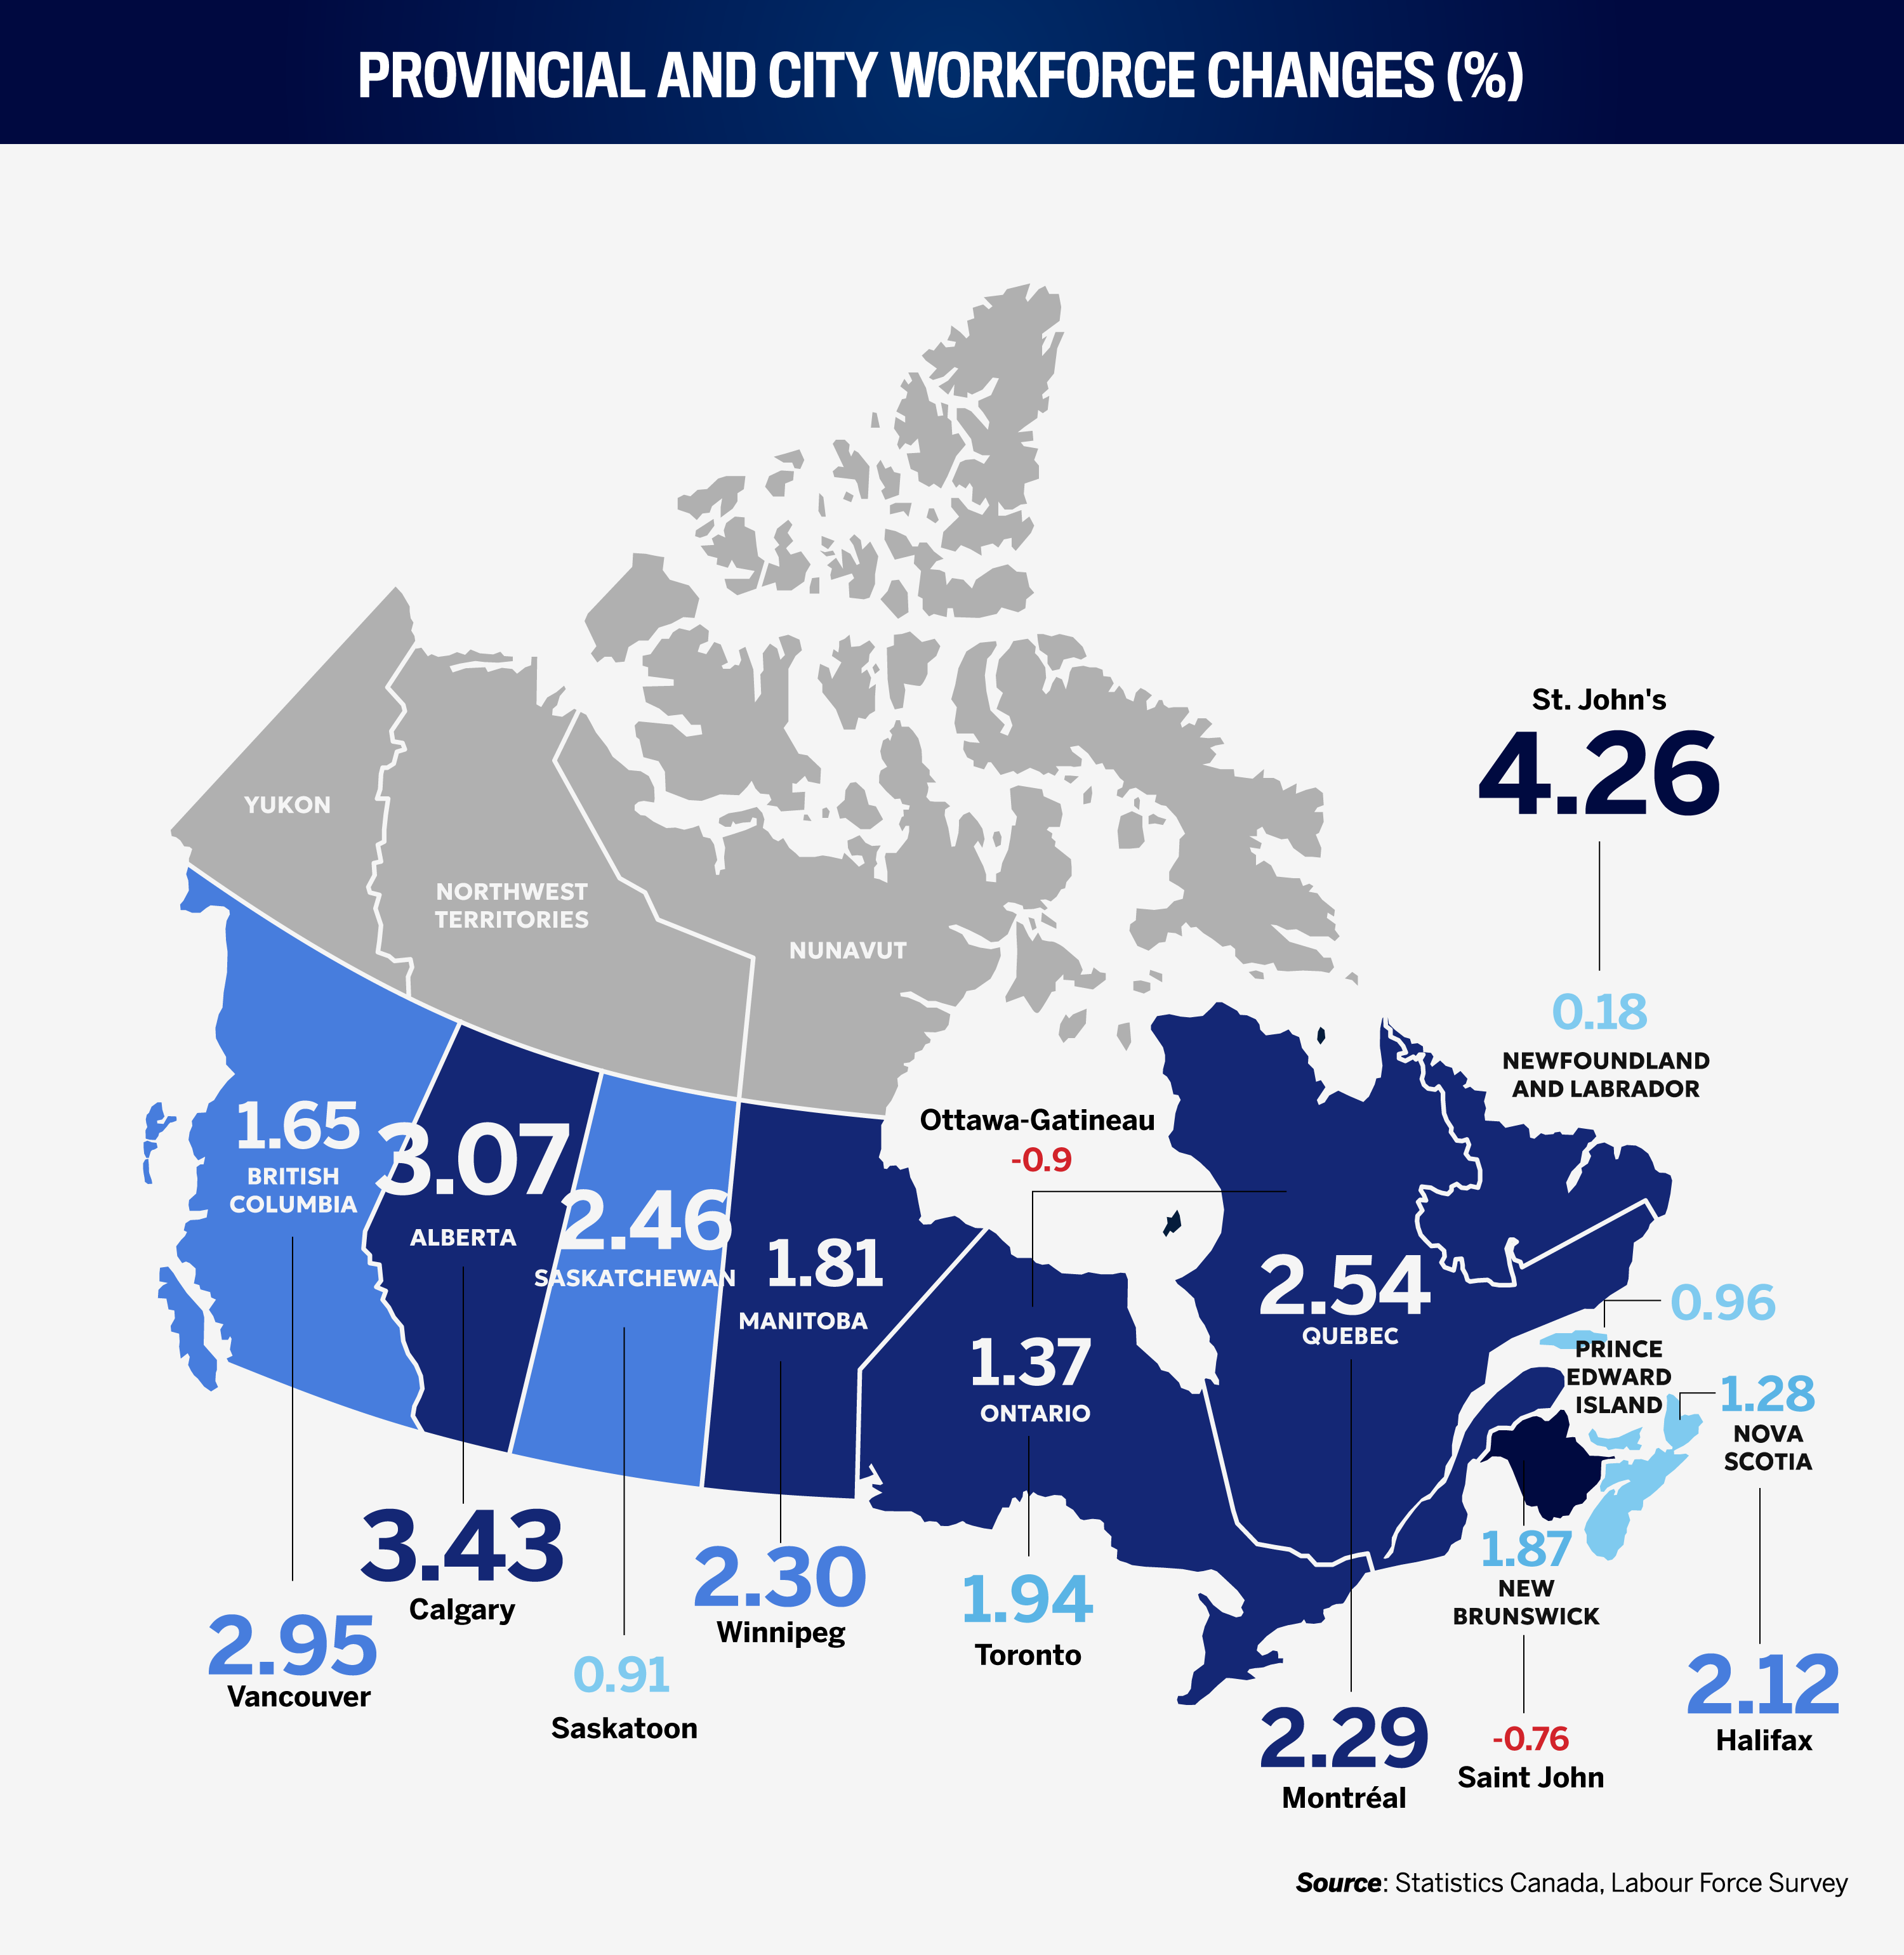
This month, Alberta leads on workforce percentage growth (+3.07 percent) and added 84,300 core-age workers over the year, consistent with ongoing strength in construction, energy, and associated services. Quebec posted the largest absolute gain (+123,900; +2.54 percent), followed closely by Ontario (+122,100; +1.37 percent). Saskatchewan’s +2.46 percent and Manitoba’s +1.81 percent indicate steady Prairie momentum. B.C. grew +1.65 percent (+51,400). Atlantic Canada’s picture is mixed: Nova Scotia rose +1.28 percent (+7,200), New Brunswick +1.87 percent (+8,300), and Prince Edward Island +0.96 percent (+1,000); Newfoundland and Labrador edged up slightly (+500), but from a smaller base.
In the cities, Toronto added 78,800 to 4.144 million and remains the country’s largest labour market, but Montréal’s +58,200 to 2.604 million and Vancouver’s +52,300 to 1.826 million show that competition is intensifying beyond the GTA. Calgary’s +36,100 and Winnipeg’s +12,300 reinforce the case for a polycentric model: both cities provide depth in professional and operational talent with less bidding than Toronto or Vancouver. Two markets contracted modestly YoY: Ottawa–Gatineau (−900) and Saint John (−600), suggesting public-sector hiring and some industrial activity are still calibrating.
Practical moves include opening requisitions simultaneously across two hubs (e.g., Toronto and Calgary; Montréal and Winnipeg), widening remote-eligible footprints for professional roles, and offering relocation support into the three strongest growth corridors (Alberta, Quebec, and Ontario). In slower-growth locales, differentiate through career-path clarity, flex arrangements, and community-rooted employer branding.
National unemployment trends: as job options recede, unemployment spikes remarkably
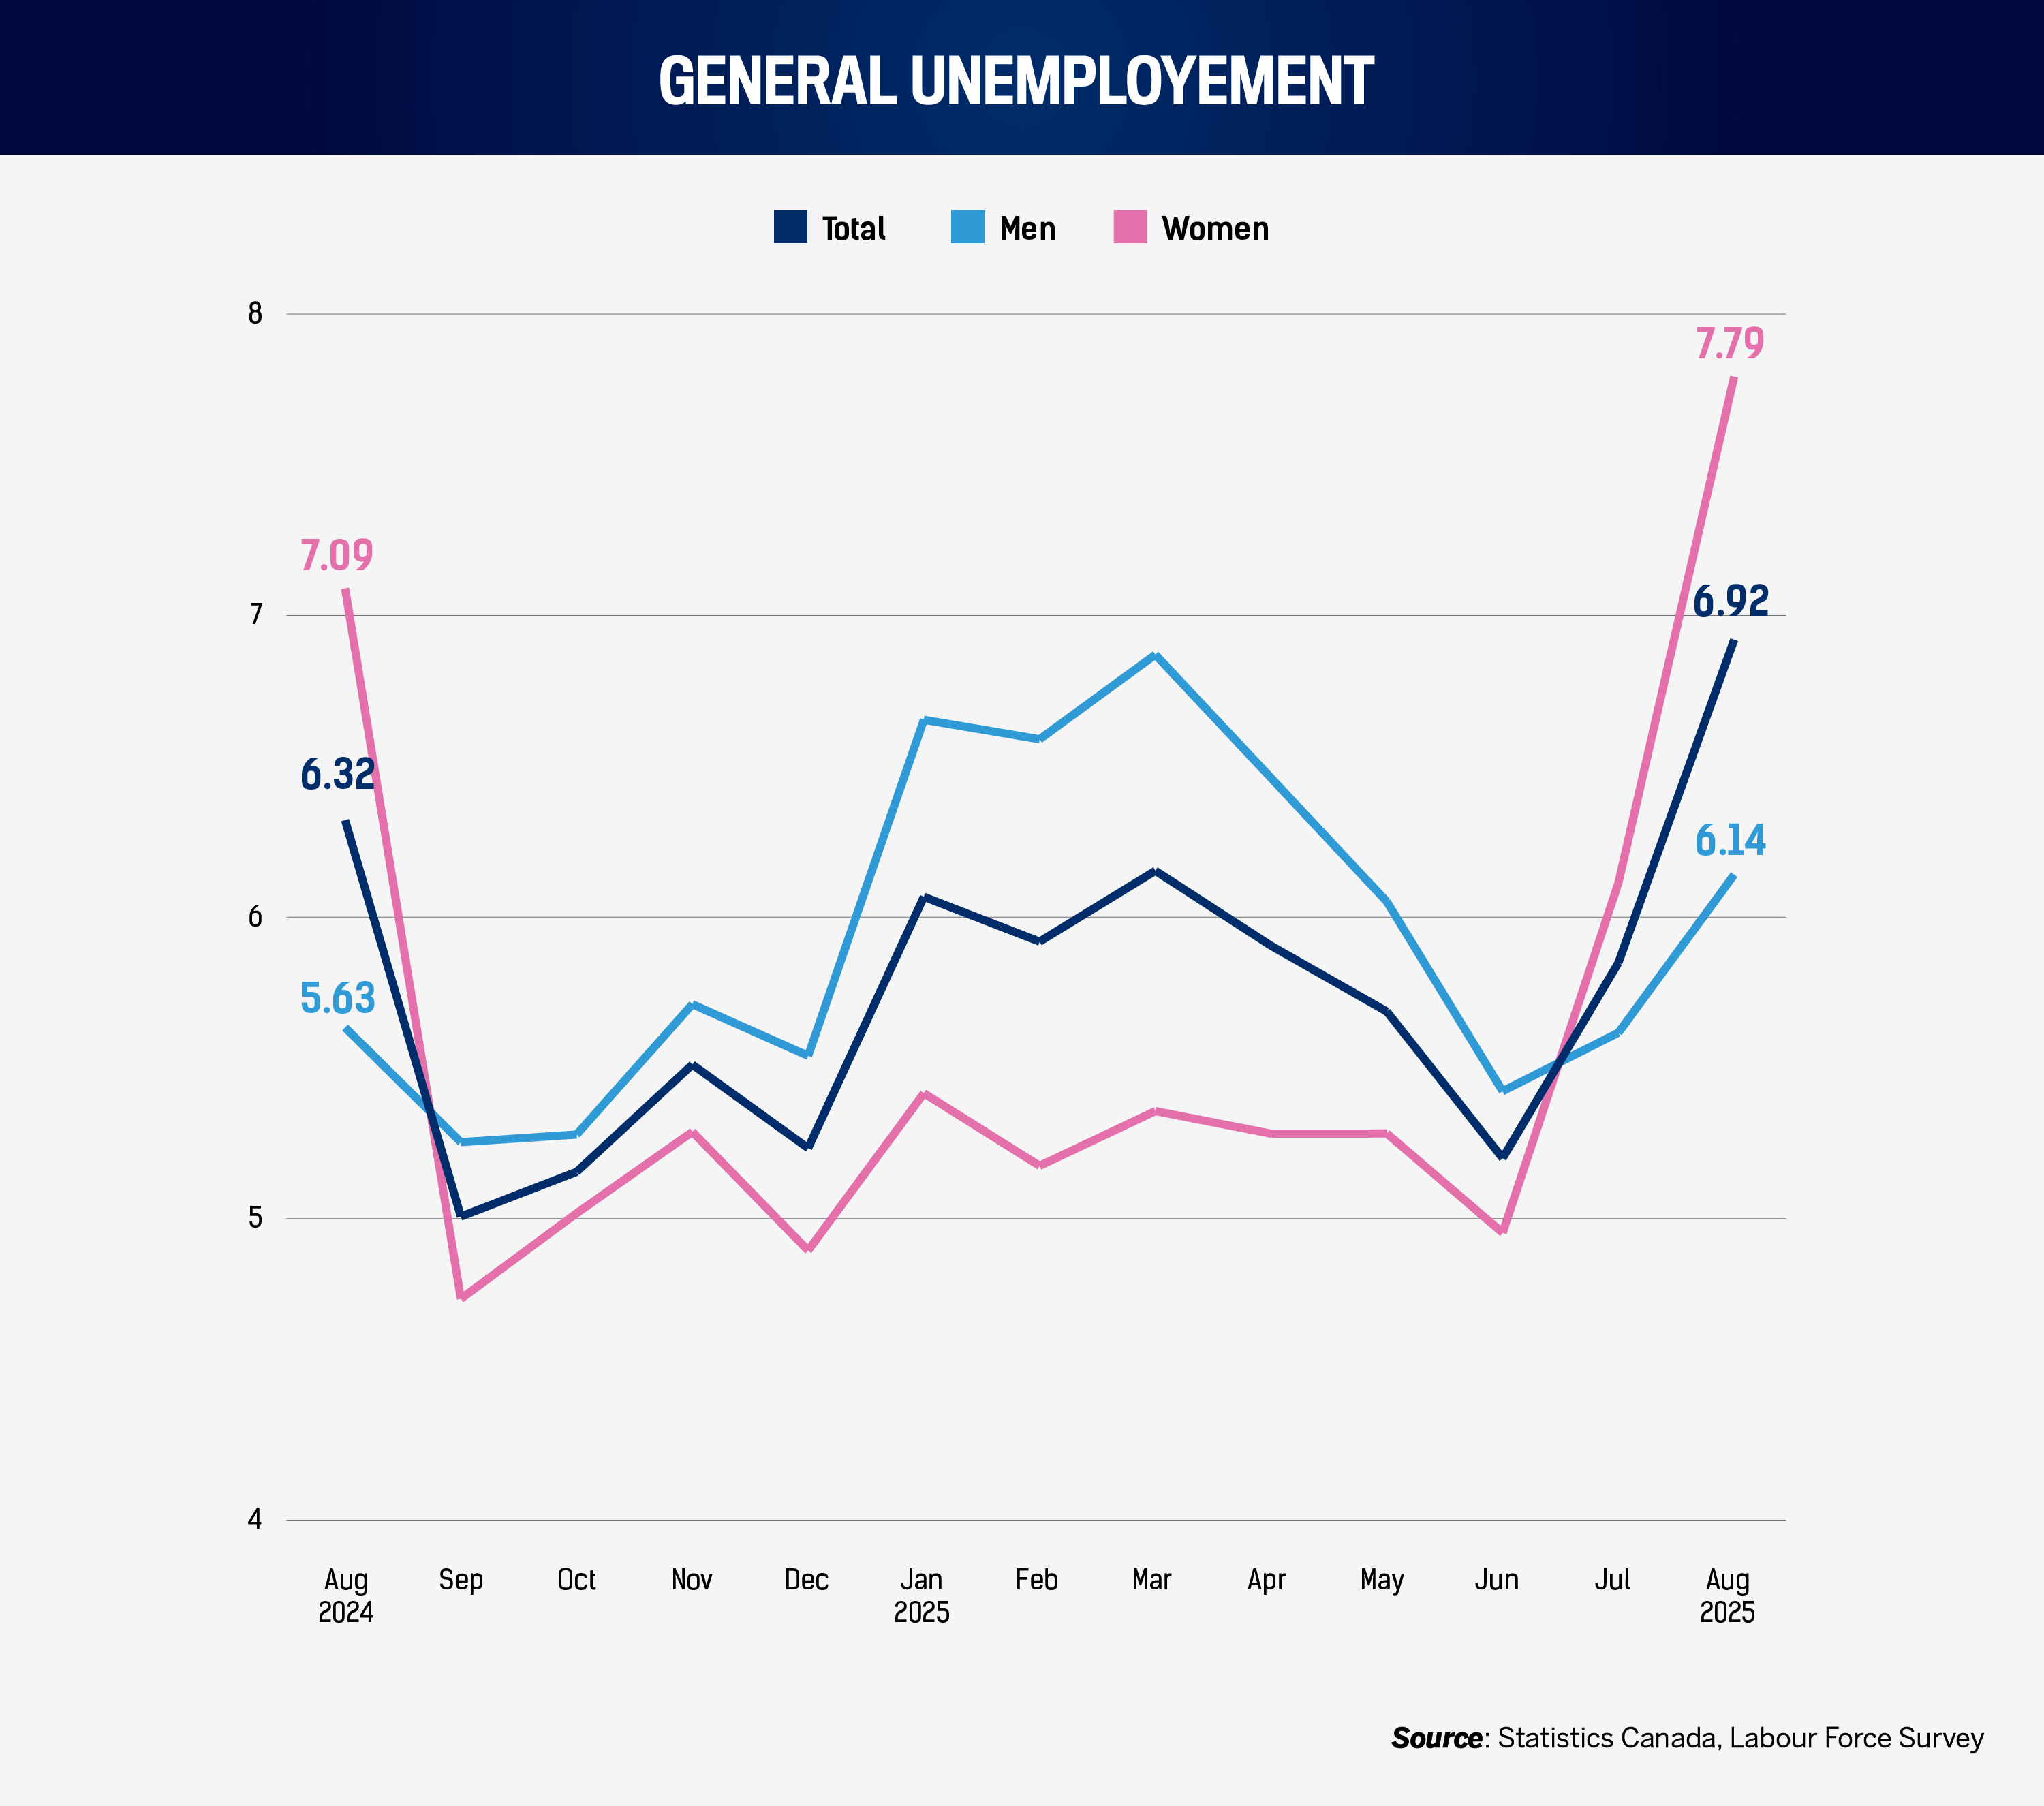
August’s unemployment jump demands attention. The core-age rate climbed to 6.92 percent from 5.85 percent in July and 6.32 percent a year earlier. Men’s unemployment rose to 6.14 percent (from 5.62 percent in July; +0.52 p.p. MoM; +0.51 p.p. YoY), while women’s increased to 7.79 percent (from 6.11 percent in July; +1.68 p.p. MoM; +0.70 p.p. YoY). The larger increase among women aligns with declines in tenure across several service-heavy sectors and with a widening gender pay gap in retail and information and culture. Employers appear to be more selective, pushing some churn into August while preserving requisitions for high-impact roles.
The hiring task gets harder when unemployment rises quickly: application volumes climb, but signal-to-noise falls. HR teams should lean on structured assessment, skills-based screening, and consistent rubric-based panel interviews to protect fairness and speed. Expect salary expectations to remain anchored to the real-wage gains outlined above; emphasis on total rewards, including benefits, flexible scheduling, and development will differentiate offers without locking in high fixed costs.
Unemployment by age and education: degrees face higher unemployment than no credentials
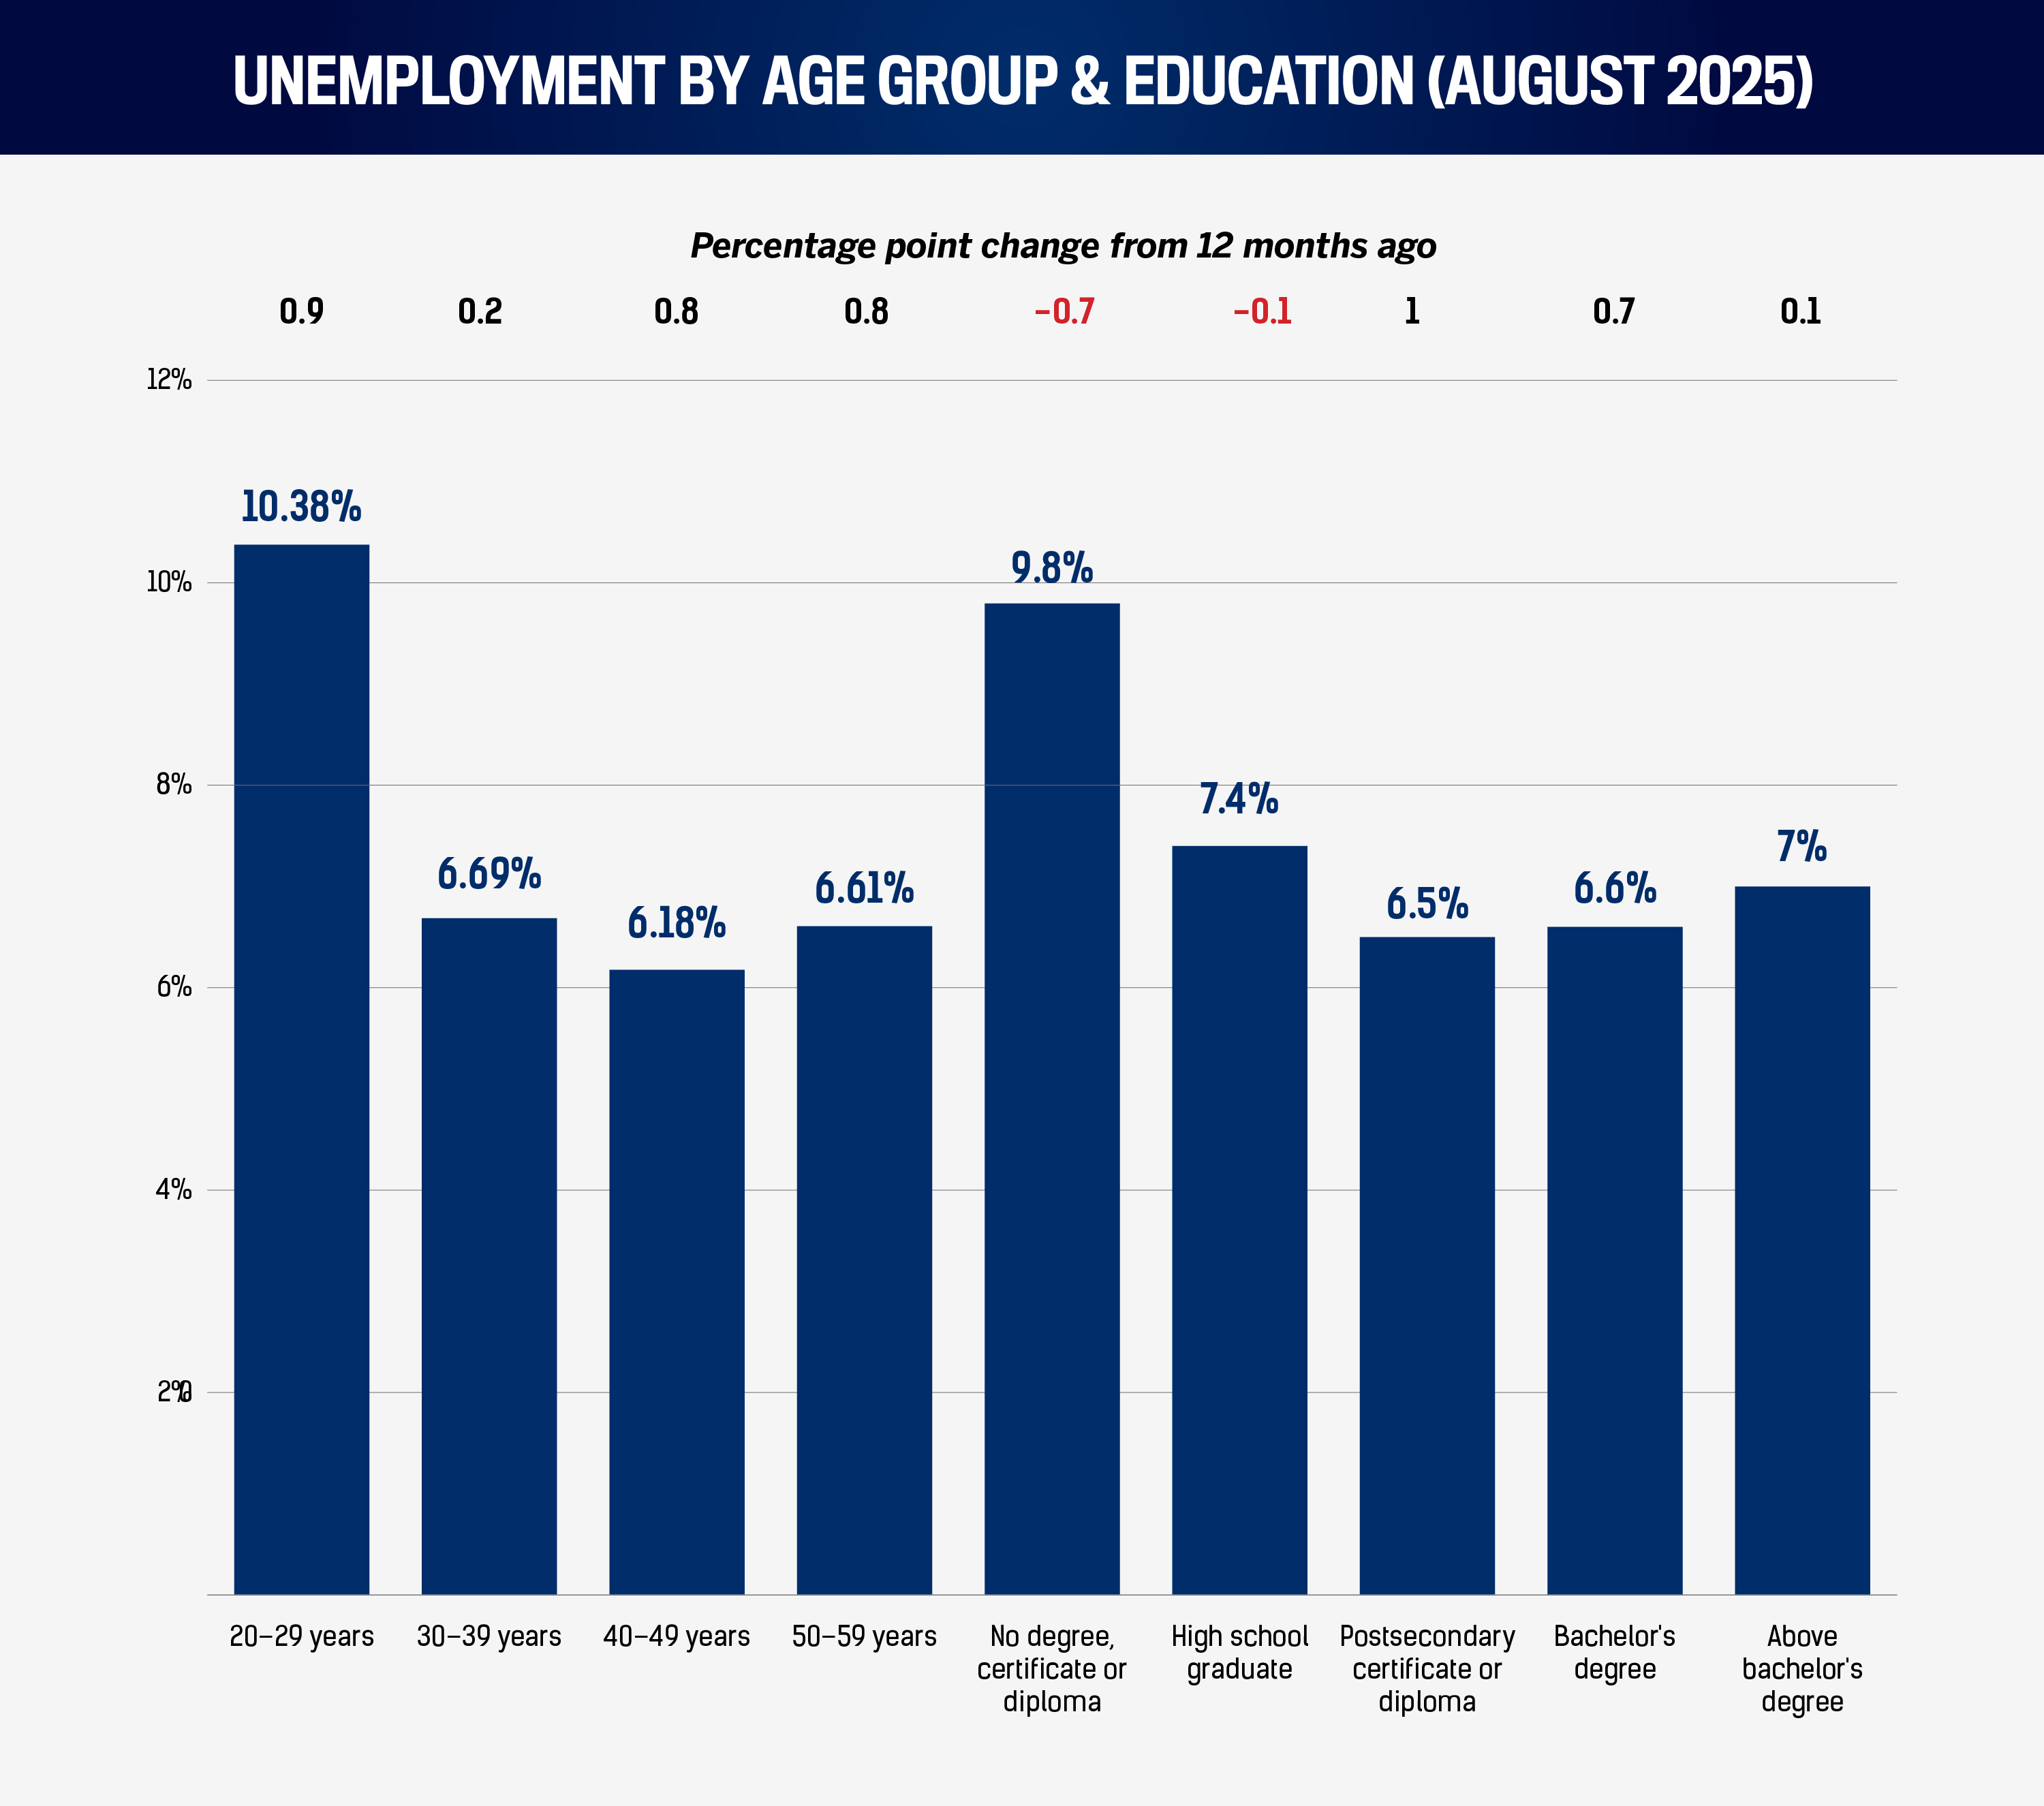
Age patterns show broad-based softening. Early-career workers (aged 20–29) remain the most exposed, with over one in 10 unemployed (10.38 percent), while mid-career groups saw the sharpest monthly jumps (30–39 at 6.69 percent, +1.19 p.p. MoM; 50–59 at 6.61 percent, +1.11). These movements match the tenure picture and the vacancy cooling outside a handful of sectors: employers are pruning or deferring mid-layer roles.
Education patterns are striking. Unemployment improved YoY for workers with no credential (9.8 percent; −0.7 p.p.) but rose among those with post-secondary (6.5 percent; +1), bachelor’s (6.6 percent; +0.7), and above-bachelor’s (7.0 percent; +0.1). MoM, rates climbed across most credentials, with above-bachelor’s up 1.5 p.p. The simplest reading is that many employers are pausing or re-specifying higher-skilled hires while continuing to absorb entry-level and operational staff. For HR, this is an opportunity to acquire high-potential talent at a reasonable cost, so long as you can offer meaningful work and progression.
Three low-cost moves will pay off. First, build “returnship” or re-entry cohorts for displaced professionals; a three-to-six-month structured placement backed by mentors retains talent at a lower upfront cost. Second, double down on skills mapping: translate adjacent experience into your job families (e.g., retail multi-unit supervisors into field operations; manufacturing quality techs into utilities inspection). Third, accelerate internal credentialing (micro-certificates and funded licenses) where vacancy-rate growth persists, converting today’s applicant surplus into tomorrow’s scarce skills.
Closing note for practitioners
This month, national vacancy pressure eased in June and payrolls grew, yet core-age unemployment jumped sharply in August while real wages continued to rise. The reconciler is selectivity. Employers are posting fewer roles in many large sectors but holding pay lines and concentrating offers in a handful of growth pockets (finance, information and culture, utilities, and real estate). Tenure slippage and tribunal activity reinforce the need for managerial basics such as predictable scheduling, safety, equity by design, and disciplined documentation. The near-term playbook is straightforward: Those in the few hot markets must move decisively, buy options on high-skill talent returning to the market, and use structured assessments to convert volume into quality.


