A new look into Canada’s labour landscape: Key insights from the May edition of Strategic HR

STRATEGIC HR, MAY EDITION
Wages rising, workforce shifting
This monthly labour market report provides HR professionals with a strategic overview of Canada’s employment landscape, drawing on the most recent data from Statistics Canada’s April Labour Force Survey (released May 9), February Payroll Employment, Earnings and Hours and Job Vacancies Report (released April 24), and March Consumer Price Index (released April 15).
Each segment looks at the most recent month compared to 12 months prior, and analyzes key trends in job vacancies, wage growth, employee tenure, and unemployment across sectors, demographics, and regions. It offers HR leaders across the country timely insights to adapt recruitment, retention, and compensation strategies in a labour market with fewer jobs, rising wages, and surprising gender trends.
Contents
Overview: Canadian job vacancies have stabilized, but tightening competition is possible
- Job vacancies rose slightly in February but remain well below last year’s highs.
- Payroll employment has slipped, suggsesting a cooling labour market.
- HR takeaway: Recruitment pressures are shifting, and employer agility and branding are essential.
Industry-specific findings: Labour demand softens in most sectors
- Vacancy rates declined across most industries, except government jobs and finance.
- Tech, education, and manufacturing showed a marked slowdown in hiring activity.
- HR insight: Focus is shifting from volume hiring to strategic retention and reskilling.
Wages vs. inflation: Wage gains continue to outpace inflation, led once more by women
- Median wages rose nearly four percent, comfortably outpacing inflation for a third consecutive month.
- Women’s wages grew faster than men’s, returning to the past 12 months’ trend after a brief hiatus.
- HR trend: Three to four percent wage growth is the new floor, as Canadian salary power continues to be in employees’ hands.
Wage growth by industry: Talent shortages, sector demand, and the economy’s edges reshape pay trends
- Year-over-year (YOY) wage growth was remarkable in digital media, support services, and natural resources.
- Stagnation hit retail, hospitality, and manufacturing – signs of contraction at the economy’s fringes.
- HR implication: Wage expectations have risen sharply in some sectors. On the other hand, low wage expectations and fewer job opportunities can be leveraged, where present.
Gender wage gaps: Despite overall growth, troubling disparities in high-wage sectors
- Despite overall wage growth, gender wage gaps widened remarkably in increasingly well-paid fields like media, tech, utilities, and professional services.
- Gaps are driven more by men’s rapid wage gains than declines in women’s pay.
- HR priority: Conduct targeted equity audits, especially in senior and technical roles.
Tenure: More wages make employees slippery
- Employee tenure declined in physically demanding and traditionally stable sectors.
- Rising wages are driving mobility, even in finance and real estate.
- HR challenge: Retention now requires early engagement, career pathways, and tenure incentives.
Litigation: Backlog clearance evident in the Prairies
- Workers’ comp cases surged in Saskatchewan, Alberta, and BC, driven by backlog clearance.
- New policies on psychological injuries and ergonomic claims are reshaping employer obligations.
- HR alert: Consider tribunal trends as risk indicators and update compliance protocols accordingly.
Overview: Canada’s labour force contracts slightly, after steady gains
- April marked the second labour force dip in nearly a year, despite strong wage conditions.
- Early retirements and delayed workforce returns may be driving the shift.
- HR insight: Reinforce value propositions to attract those opting out of the workforce.
Provinces: Growth strongest in Quebec, Manitoba, and Alberta
- Quebec led national labour force growth, fueled by record immigration.
- Ontario and Eastern Canada saw slower provincial gains, or none at all.
- HR strategy: Tailor recruitment plans to regional talent dynamics and mobility trends.
Cities: Urban labour growth surges in Winnipeg, Moncton, and Montréal
- Winnipeg and Moncton outpaced their provincial growth, becoming urban hiring hotspots.
- Montréal absorbed most of Quebec’s provincial labour force gain.
- HR takeaway: Urban-focused recruitment offers the highest returns, especially in under looked Canadian cities with increasingly attractive living standards.
General unemployment: Re-entry opportunities
- HR note: Gender-specific strategies can close gaps and strengthen workforce resilience.
Age groups: Youth and late-career workers hit hardest by rising unemployment
- Unemployment rose most among young adults and those aged 50–59.
- HR focus: Prioritize onboarding for youth and reskilling for older talent pools.
Educational attainment: Unemployment rises for educated workers, declines for less educated
- Unemployment increased for college and university graduates and declined for those without diplomas.
- HR tip: Embrace skills-based hiring to access overlooked but available talent.
1. Job vacancies
Overview: Canadian job vacancies have stabilized, but tightening competition is possible
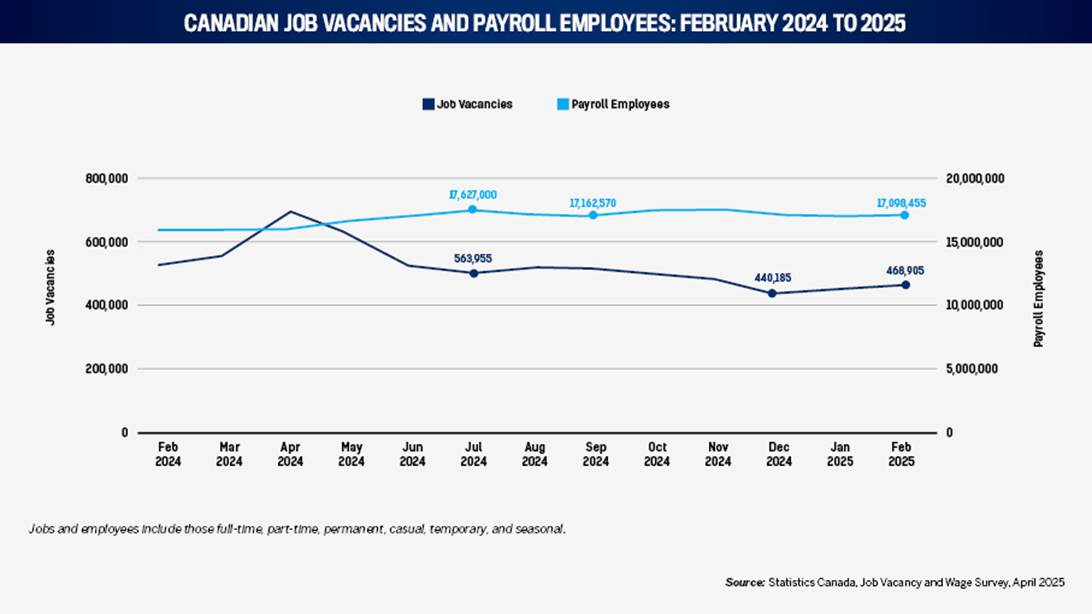
From December 2024 and February 2025, available jobs (job vacancies) in Canada rose modestly from 440,185 to 468,905. This was a 6.5 percent two-month increase, and the highest two-month vacant job increase since April 2024. This is a remarkable rebound from the four-month slide in open jobs, which began after April 2024 and bottomed in January.
Job demand may be stabilizing, even rebounding, after several months of fewer offers. Nevertheless, total job vacancies are 27 percent below their April 2024 peak of 642,810, as employers show less demand for workers than they did one year ago.
The number of payroll employees filling roles, meanwhile, was relatively steady at 17,098,455. That’s less 370,000 (or -2 percent) from January, bringing the number of payroll employees to their lowest since February 2024. Employment growth has been marginal in the 12 months at only 0.6 percent since February 2024. Taken together, the monthly and 12-month trend shows a labour market beginning to cool as the number of employees reaches its lowest since February 2024.
Indeed senior economist Brendon Bernard said in an April report for CHRR: “The spurt of momentum in the job numbers at the turn of the year ended up being short lived. After a flat February, as employment slipped, while total hours worked only barely edged up, following a sharp weather-induced drop ... the employment drop was concentrated among full-time private sector employees, only partially offset by a rise in self-employment, which has perked up in recent months.”
February’s rise in job vacancies, amid relatively stable but declining employee numbers, implies the existence of new roles to be filled across the job market. If employee numbers continue to trend downward, hiring competition may increase throughout the year. Nevertheless, the vacancy-to-employee ratio remains lower than last spring, which means less pressure on hiring pipelines than a year ago.
For HR professionals, this means short-term recruiting conditions may be improving for employees, particularly for hard-to-fill roles. February’s uptick and the reserves of months of decline in the number of available jobs should serve as a reminder to remain agile in talent sourcing while leveraging employer branding and retention strategies.
Industry-specific: Labour demand softening in most sectors
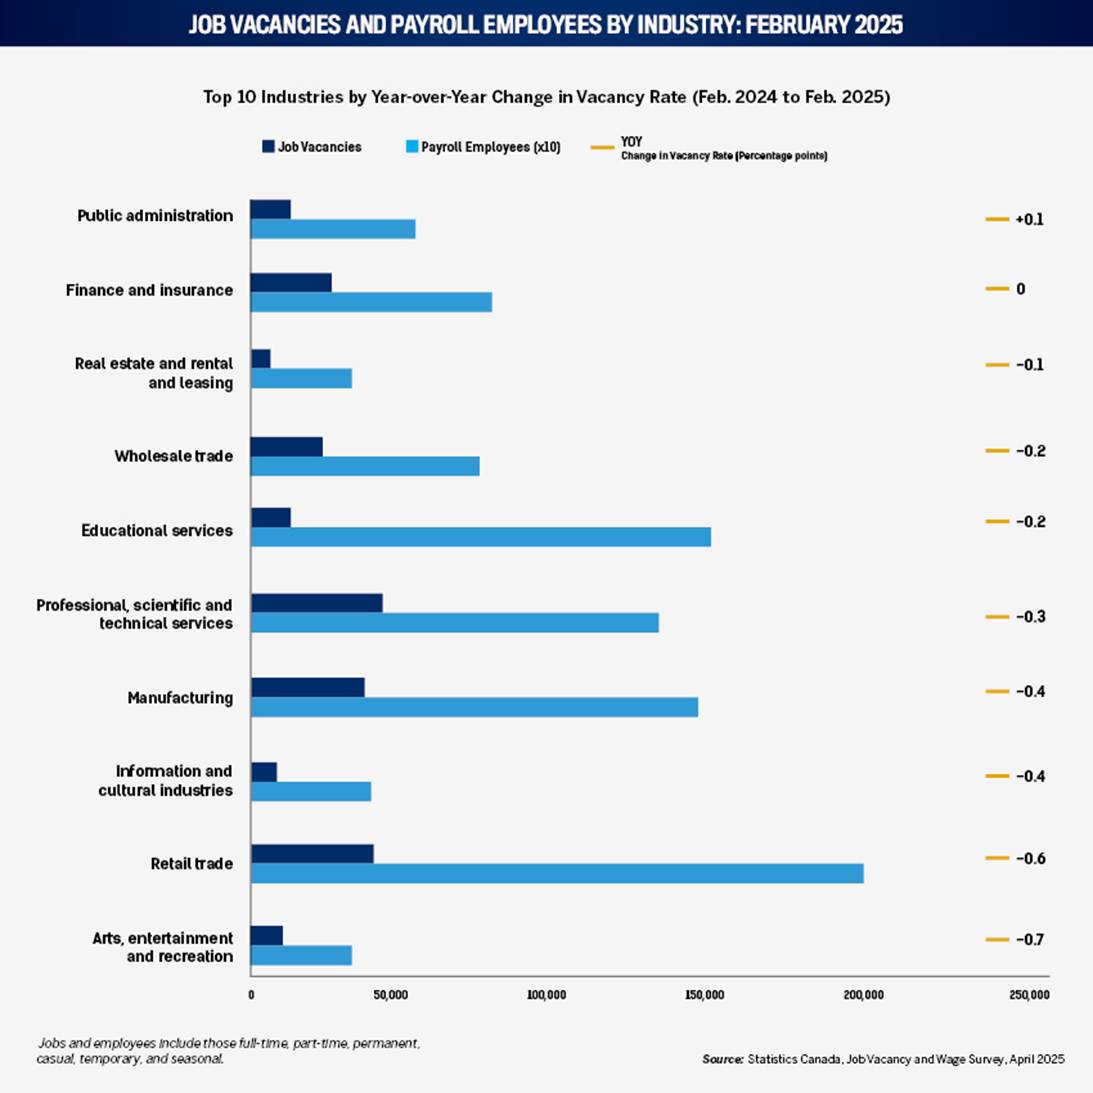
In February 2025, only public administration registered a YOY increase in the number of available jobs as a percentage of occupied and available jobs (job vacancy rate). For all industries, this reflects the broad hiring pullback pointed out above. Compared to February 2024, job vacancies in public (government) administration increased only 0.1 percentage points to 2.8 percent. Total available government jobs jumped from 15,400 to 16,440 YOY, a 6.75 percent increase, while the number of hired employees only climbed 3.65 percent to 569,290. These additional vacancies were likely driven by hiring for Canada’s recent federal election. Nevertheless, competition for public-sector talent could be increasing for administrative and regulatory roles that require mid-career expertise.
Finance and insurance came next in the rank of industries with the widest growth of vacancies. However, true to the job contraction trend described above, finance and insurance had zero net vacancy change in the 12 months between February 2024 and 2025. In February 2025, the industry had 22,940 vacancies, increasing from last year’s 22,265 unfilled positions. The number of employees also grew to 842,225, adding 13,000. The flat change in finance and insurance’s job vacancy rate suggested steady, perhaps cautious, Canadian hiring amid digital transformation and AI adoption in financial services. AI has particularly stalled recruitment in the detail-oriented industry; that month, Bloomberg reported a swarm of AI-generated résumés across US banks.
Remaining industries’ available jobs as a share of all jobs have diminished. Between February 2024 and 2025, real estate, rental and leasing job vacancies shrank least of all, by 100 to 6,650, with a 0.1-point drop in the vacancy rate. Cooling property markets may cause HR recruiters to see fewer urgent roles to fill, but some needs may persist in property management and leasing roles.
Wholesale trade and educational services posted 0.2-point drops in job vacancies as a share of all jobs. Wholesale job vacancies fell from 23,330 to 22,020 YOY and, notably, employee levels fell from 828,000 to 816,000. Demand and opportunity in Canadian wholesale trade is falling.
Vacant education opportunities were down 6.2 percent YOY to 16,010 in February 2025. Employment, though, rose 4.6 percent. In education, the job vacancy decline signals tightening education budgets, not lower job demand. HR leaders in Canadian education should be mindful of sudden reversals in hiring cycles and public funding changes.
Professional, scientific, and technical services saw an 11.8 percent drop in job postings and a 0.3-point decline in vacancy rate, a trend similar to that in wholesale trade, reflecting a further cooldown of the tech hiring boom. Manufacturing also eased, with job postings falling 13.4 percent and a 0.4-point vacancy rate drop, although payrolls held steady.
Information and cultural industries showed early signs of contraction, likely related to remarkable wage growth, which is detailed below. The greatest YOY job vacancy rate contraction occurred in construction and transportation, with a drop of 1.5 points each to 3 percent and 2.9 percent, respectively. Both industries face performance difficulties, outlined by hiring challenges such as tenure and wage competition elaborated below.
Across these top 10 sectors, for annual job vacancy expansion in February (among which only one sector saw vacancies truly expand), the common thread is a moderation of employer urgency. Even in sectors with high absolute job vacancies, the rate of employee increase has slowed or reversed. The pressure or ability to fill roles may be easing, but so is the momentum for talent acquisition sought after in HR professionals. This represents both relief and risk. Therefore, HR leaders should adapt by:
- rebalancing hiring strategies toward retention and internal mobility,
- prioritizing job redesign and digital reskilling, and
- preparing for asymmetrical recovery, where public-sector and knowledge-intensive industries may heat up again before consumer-facing ones.
2. Wages
Wages vs. inflation: Wage gains continue to outpace inflation, led once more by women
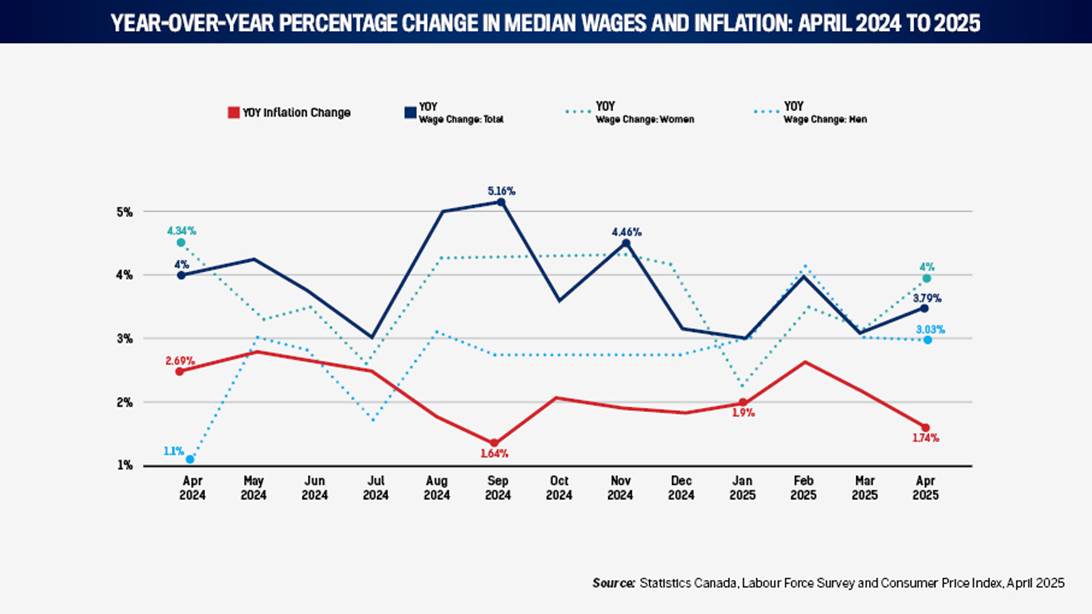
In April 2025, the growth of Canadian’s median hourly wages continued, reflecting a remarkable resilience against inflation. It rose 3.79 percent YOY. This exhibited a positive spike for workers’ wage power because it was near the average YOY wage increase of 3.9 percent over the past 12 months, a period marked by impressive growth up to 5.19 percent.
Inflation YOY, meanwhile, rose by a comparatively low 1.74 percent. That was the second lowest YOY increase in the past 12 months. In April, the gap between YOY wage and inflation growth was the largest since the new year. This shows that Canadians’ real wages are improving.
Last April, women saw stronger wage growth (4 percent) compared to men (3.03 percent). Despite a brief hiatus during the new year, women’s wage growth has been strong and more than men’s throughout the past 12 months. This divergence may reflect faster wage adjustments in female-dominated sectors, where vacancy pressures remain high and policy-driven funding has stabilized pay. For instance, for 2024 and 2025, Canada’s Department for Women and Gender Equality (WAGE) allocated substantial funding to initiatives that support women’s job participation and leadership in administration and education. Despite the relative improvement of women’s wages over the past year, the most recent data shows concerning gender pay gap trends in high-paying industries, detailed further below.
Two implications stand out to recruiters. First, in wage negotiations, the benchmark is no longer just keeping pace with high inflation; wage expectations have reset, with a three percent to 4 percent annual increase viewed as a baseline. Offers below this threshold may be seen as lagging, particularly in skilled or in-demand roles.
Second, a continuing gender-wage dynamic underscores the importance of pay equity analysis and transparent compensation. As wage compression is seen in some sectors and expansion in others (detailed next), fairness will be critical to both retention and recruitment strategies.
Wage growth by industry: Talent shortages, sector demand, and the economy’s edges reshape pay trends
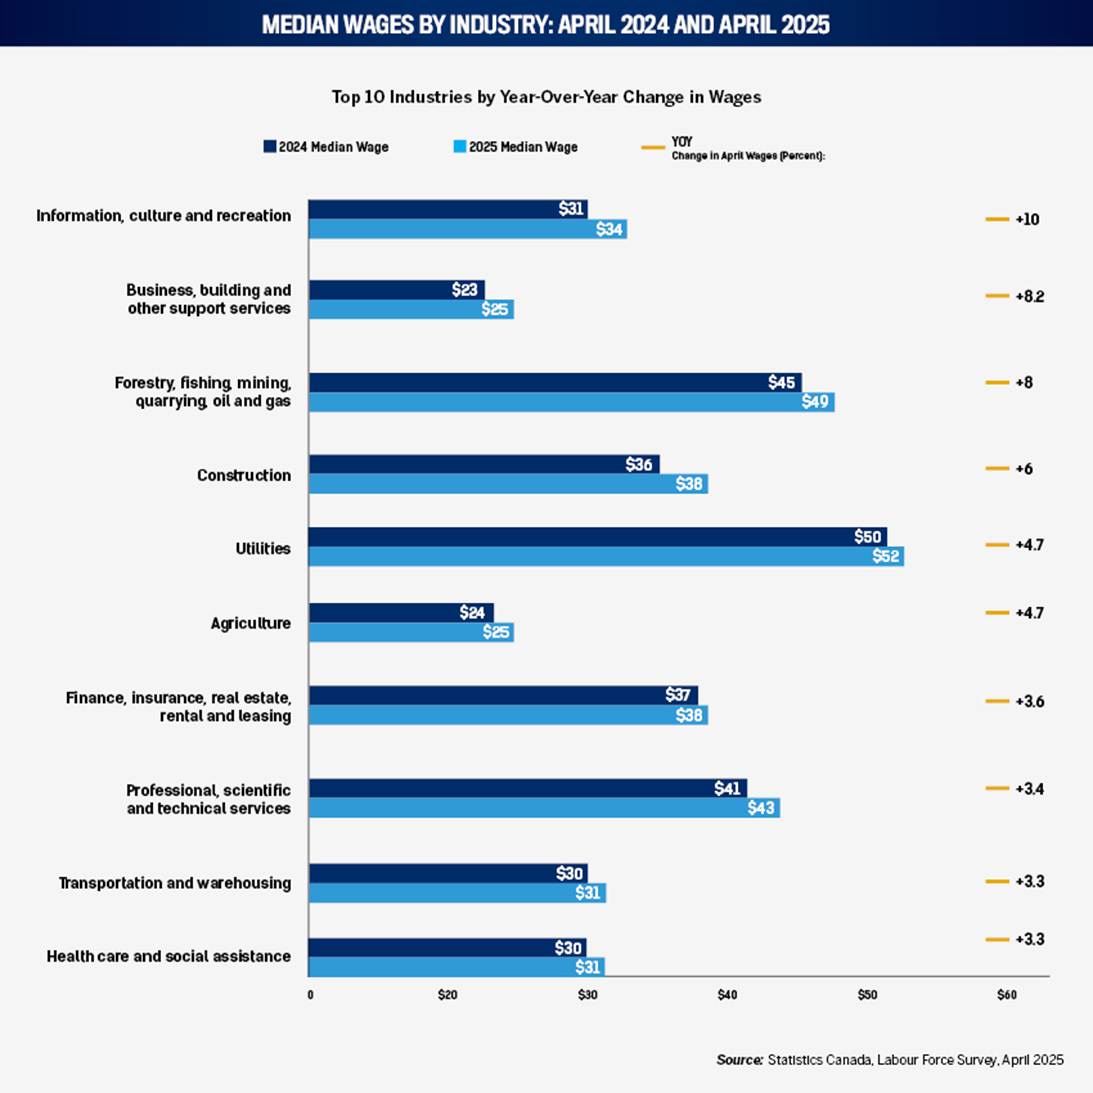
Despite Canadian wages broadly outpacing inflation between April 2024 and 2025, those gains have not been equally distributed across industries. In April 2025, the top 10 performing industries posted median hourly wage gains ranging from 3 percent to 10 percent YOY.
The information, culture, and recreation industries led with April’s only double-digit YOY percentage increase. There, April’s median wages jumped 10 percent from $31.25 to $34.40. The persistent tech talent shortage in Canada has led employers to offer competitive compensation packages to attract and retain skilled professionals. This environment has compelled companies in streaming, digital media, and gaming to enhance their wage offerings, contributing to enviable median wage growth.
The next greatest increase is business, building and support services, up 8.2 percent to $25. This sector manages companies through administration, hiring, documentation, client management and others. Its strong wage performance signals that even lower-wage and high-turnover sectors are raising compensation to attract and stabilize their workforce.
Likewise, the already high-paying forestry, fishing, mining, quarrying, and oil and gas industry saw median wages climb 8 percent, reaching $49.52. This was likely driven by rising resource sector profits and demand for isolated field-based roles, supported by increasingly favourable Canadian policy.
Construction (+6 percent), utilities (+4.8 percent), and agriculture (+4.7 percent) have faced chronic labour shortages, and April’s YOY median wage growth in those sectors reflect both competition for skilled trades and catch-up adjustments in essential services. For sectors where April 2025’s wages are inert or receding compared to 12 months prior, look to manufacturing (0.8 percent), wholesale trade, accommodation (both of which saw zero change), and other services (-0.7 percent). The last one was the only unfortunate sector to see median wages decline since April 2024. It comprises the edges of the economy such as repair companies, wedding planning, laundry services, grant-writing, and the like. Lowest wage growth for these three industries, taken together, are symptoms of the Canadian economy losing profits at its edges.
This wage stratification calls for nuanced compensation strategies. In high-growth industries, simply matching inflation is no longer sufficient. Rather, HR teams should benchmark pay within industry and role tiers, prioritize transparency, and anticipate rising wage expectations in sectors experiencing retention pressures.
Gender wage gaps: Despite overall growth, troubling disparities in high-wage sectors
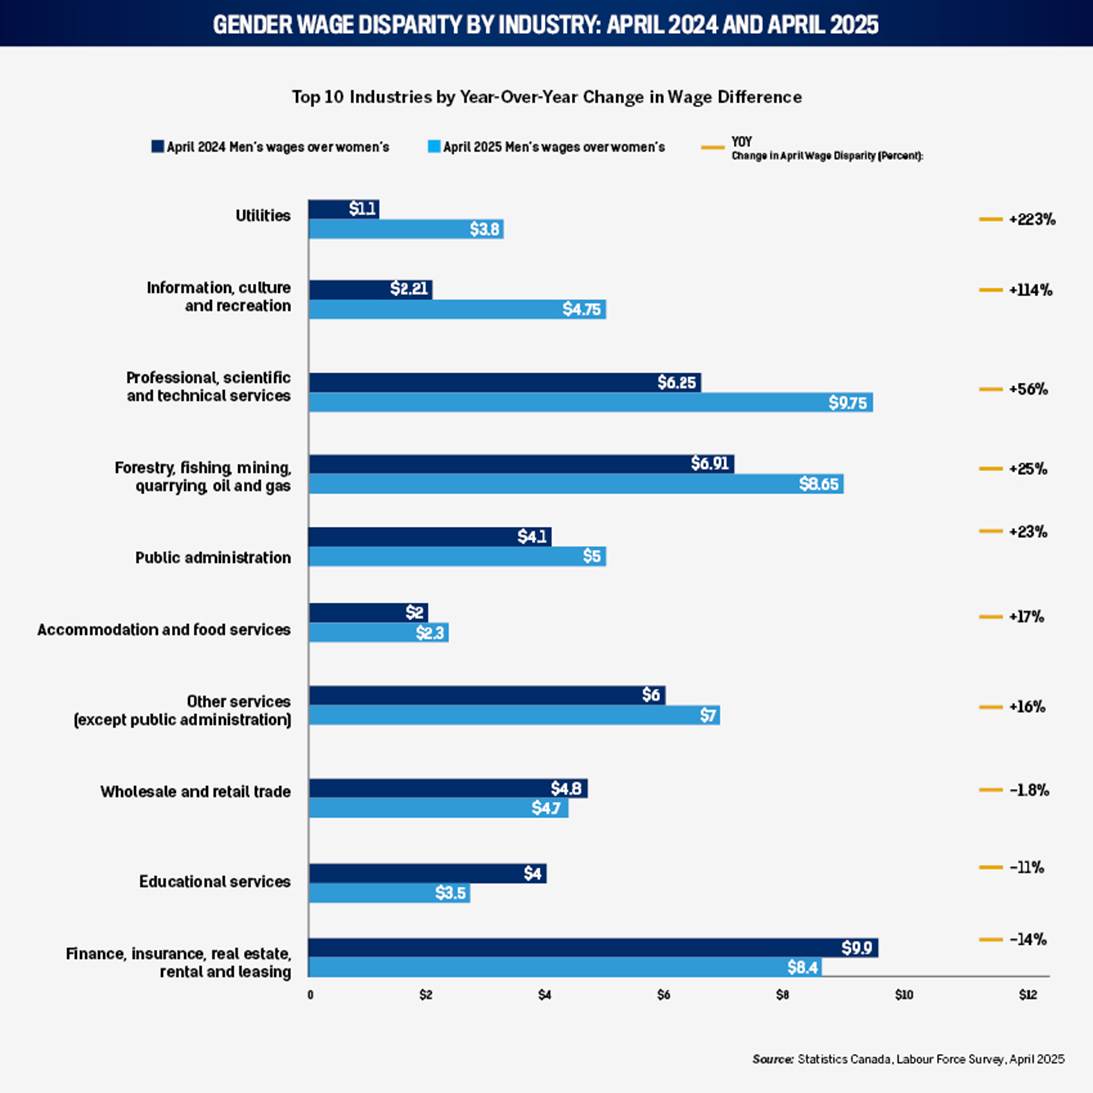
Despite broad wage gains for Canada’s best-paying sectors, April data points to those same sectors widening the wage gap between men and women. Between April 2024 and April 2025, the difference between men’s and women’s median wages increased sharply in utilities, information and culture, professional services, and natural resources, among others.
Utilities saw the most striking widening between women’s and men’s hourly wages. These companies operate gas, electric, and water services. Most are public companies – 60 percent of Canadian electricity providers are owned by municipalities. In the 12 months following April 2024, the difference between men’s and women’s median hourly wages tripled from a difference of $1.19 to $3.85 per hour. This occurred even as the sector’s overall middle hourly wage rose from $50.48 to $52.88. Men’s wages grew to $53.85 per hour, while women’s remained unchanged at $50. Utilities are already among the highest-paying industries, and the expansion of this gap suggested male overrepresentation in newly created or better-compensated roles.
Information, culture, and recreation saw its hourly wage gap more than double from $2.21 to $4.75, despite both genders seeing raises. Between April 2024 and 2025 in this sector, women’s median wage rose from $30 to $31.31, while men’s rose from $32.21 to $36.06. Men have evidently outsized inclusion in this sector’s remarkable median April wage gain of 10 percent, as detailed above.
Professional, scientific, and technical services, a high-paying sector often seen as a bellwether for equity in the information economy, witnessed its pay gap climb by 56 percent and reaching a difference of $10/hour. Despite median hourly pay for women remaining at $38.46 in the past year, men’s median pay surged $3.50 to $48.21. If sustained, this could erode gains made during the tech-sector’s diversity drives throughout the decade.
Other sectors with significant widening gaps include forestry and mining (+25 percent) and public administration (+23 percent). There, gender wage parity clearly made poor progress since April 2024, despite modest overall wage growth.
These widening disparities witnessed in April’s data are a large red flag for Canadian HR professionals. In many cases, the gap is growing not because women’s wages fell with, but because men’s accelerated more rapidly, likely due to promotions, sectoral demand spikes, or pervasive role stratification. CHRR+ will closely monitor and update these trends in future reports.
To adapt to these trends, HR teams should:
- audit compensation practices for role-specific gender discrepancies, especially in senior and technical roles;
- use intersectional pay equity reviews to identify gaps obscured by broad medians; and
- consider structured promotion and bonus policies to ensure wage mobility is equally accessible.
Agriculture stood out as the only industry where the gender wage gap fell enough to reverse YOY. The industry comprises establishments engaged in growing crops, raising animals and harvesting timber. While last April, men made $2.4/hour more than women in this field, this April, women earned $1.71/hour more than their male colleagues.
Although its gender gap didn’t reverse, between April 2024 and 2025, transportation and business services reduced their hourly median wage gaps by 45 percent and 31 percent, respectively.
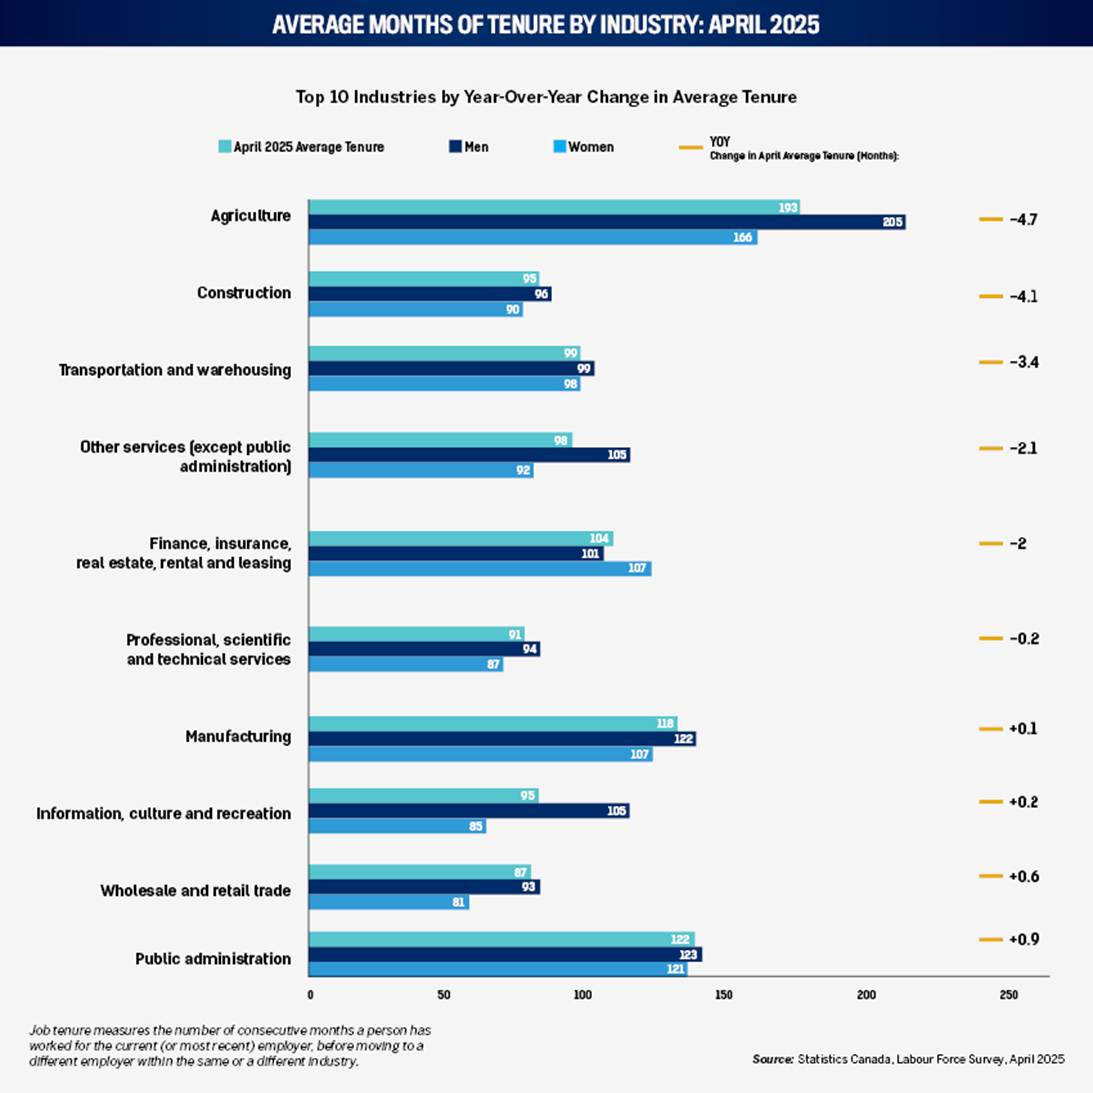
In April 2025, the Canadian labour market showed signs of rising mobility, as employees in several sectors reported shorter average tenures than a year earlier. Here, tenure is measured as the average length of months an employee stays with one employer before moving to a new employer within the same or a different industry. The most notable declines occurred in agriculture, construction, and transportation and warehousing, roles that are physically demanding, heavily affected by seasonal or economic volatility, and increasingly wage competitive.
Agriculture experienced the sharpest drop, with average tenure falling 4.7 months, from 198.1 to 193.4 months. While workers in this sector still show remarkably long average stays with their employer, this recent shift may reflect a generational turnover among older workers or increased use of short-term contracts, especially in seasonal crop and livestock operations.
Construction, with already modest tenure levels, saw a 4.1-month decline to 95.2 months. The fall aligns with reports of churn amid remarkable labour demand and volatile project pipelines. The implications for HR professionals are direct: retaining skilled labourers may require more structured career pathways and non-monetary incentives, such as flexible scheduling or long-term project pipelines.
In transportation and warehousing, tenure decreased by 3.4 months, now sitting at less than 100 months. Despite rising automation, the sector still relies on experienced drivers and warehouse personnel. The loss of long-tenured staff due to job security fears may increase onboarding costs and safety risks.
Remarkably, finance, insurance, real estate, and leasing – typically seen as a stable white-collar domain – posted a two-month decline in tenure. The average employer stay dropped to 103.8 months, with men more likely to leave sooner than women. The concept of “phygital” services, blending physical and digital environments, is gaining traction, leading to the evolution of real estate as a service. This approach emphasizes the importance of digital amenities and flexible workspaces to meet the changing demands of tenants and employees.
Success stories for increased average months of tenure between April 2024 and 2025 include accommodation (+8), forestry (+7.6) and business, building, and other support services (+2.4). Accommodation median wages were stagnant, but job vacancies declined by nearly 10,000; this sector provides as an example of low job prospects amid low wage growth shoring up retention. In the business services sector, employers have been proactive in adjusting salaries to retain talent. A Normandin Beaudry survey revealed that 65 percent of organizations allocated additional budgets in 2024 to support market adjustments to salaries, and 51 percent did so to retain employees in strategic or critical roles. These targeted wage increases have likely played a significant role in enhancing employee tenure within the sector.
Last April, business services and financial services were the only to see women stay with their employer longer than men, by three and six months on average. Notably considering the wage and gender-disparity trends outlined above, in April, men employed in information and culture industries stayed on with their employer 20 months longer than woman on average – an increase of six months in that gender retention difference compared to April last year.
Amid competition of rising wages, the data signal that employee stickiness is declining even in historically stable sectors. For HR professionals, this means:
- investing in succession planning and cross-training to buffer institutional knowledge loss;
- re-examining the early months of onboarding where high turnover originates;
- considering tenure-linked benefits or incentives, especially in sectors where the physical toll or cyclical instability makes long-term employment less attractive.
Litigation: Backlog clearance evident in the Prairies
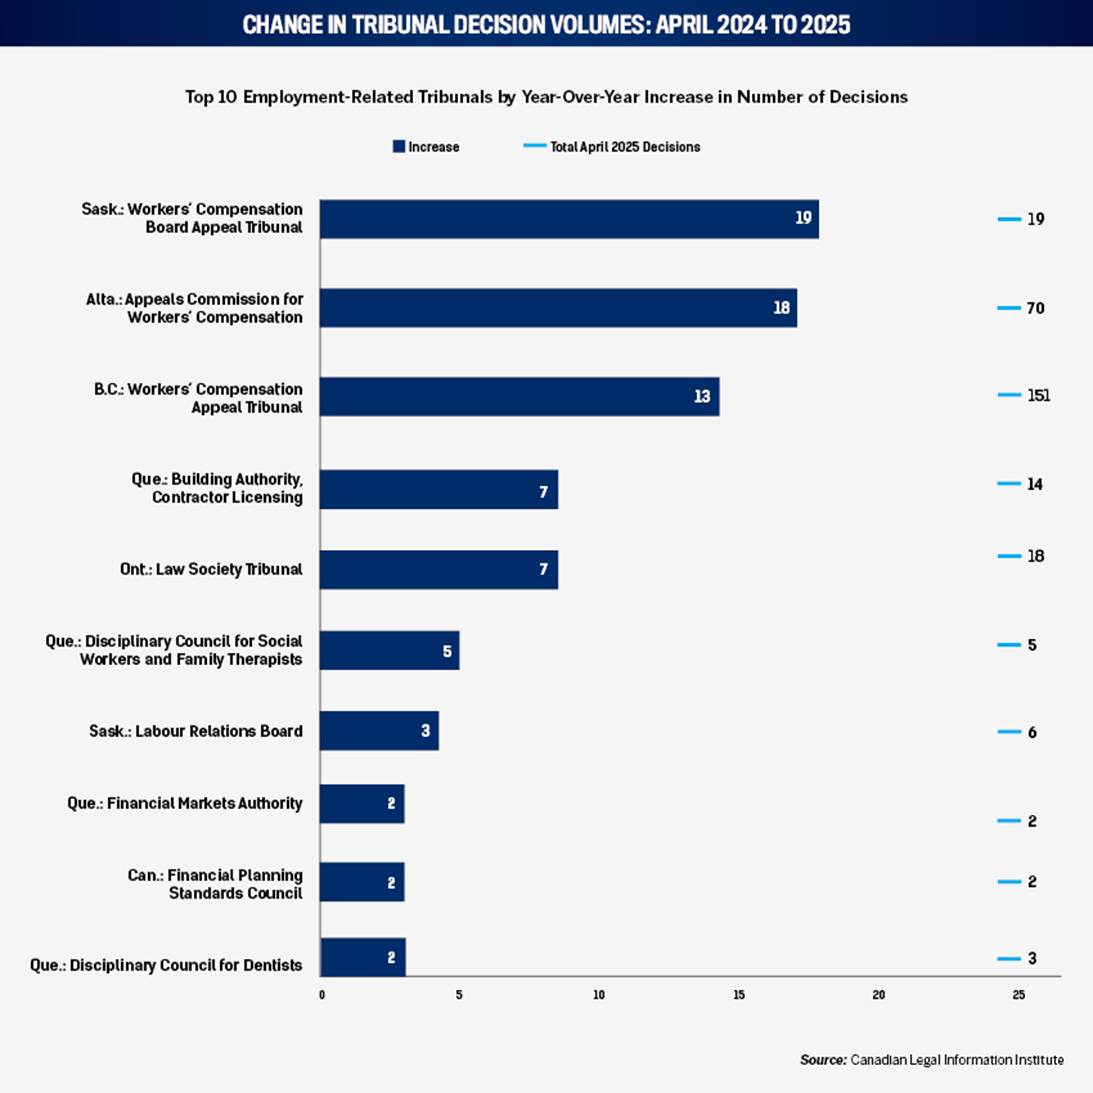
Year-over-year April spikes in employment-related tribunals case decisions reflect growing disputes in labour rights and occupational safety, as well as backlog resolution, in unique areas of Canada.
The Saskatchewan Workers’ Compensation Board Appeal Tribunal posted the greatest increase in April decisions, going from 0 in April 2024 to 19 in April 2025. This sudden increase suggests backlog clearance or renewed focus on appeals tied to workplace injuries. In all of 2024, for instance, Saskatchewan’s compensation board saw only one appeal decision. In April 2025, many of the 19 cases originated years ago, as early as the 1990s. HR leaders in Saskatchewan should ensure meticulous documentation of return-to-work programs and reinforce safety training protocols. Likewise, be aware that such clearance efforts in Saskatchewan may temporarily inflate case volumes, and impact financial planning for employers with legacy claims still open or subject to review.
In Alberta, the Appeals Commission for Workers’ Compensation registered an 18-case increase, up to 70 decisions in April 2025. Alberta employers must ensure internal processes around ergonomic claims and psychological safety meet the Workers’ Compensation Board’s evolving standards. In April 2025, the Board adopted the DSM-5-TR for assessing psychological injuries and the 2024 Sixth Edition of the American Medical Association Guides for evaluating permanent impairments.
British Columbia’s Workers’ Compensation Appeal Tribunal, meanwhile, saw 13 additional cases in April 2025, totaling 151 decisions. On April 25, 2025, WorkSafeBC approved significant policy updates to adjudicate activity-related soft tissue disorders (ASTDs) of the limbs.
April saw rising volumes in several tribunals outside the traditional workers’ compensation sphere. In Quebec, the Building Authority’s contractor licensing tribunal and the Disciplinary Council for Social Workers and Family Therapists both doubled in case activity. These increases suggest regulatory friction either from increased enforcement or professional conduct reviews, which HR professionals in regulated sectors and jurisdictions should closely monitor.
In Ontario, the Law Society Tribunal recorded 18 April 2025 cases, up from 11 the year before. While not an employment tribunal per se, it reflects broader accountability mechanisms affecting legal employers. Firms should bolster ethics training and internal reporting channels.
Finally, disciplinary bodies in Quebec and federal finance sectors also saw modest increases. While numerically small, decisions by the Financial Planning Standards Council and Disciplinary Councils for Dentists and Financial Advisors often carry reputational weight. Proactive compliance reviews and whistleblower support mechanisms are essential for HR in these fields.
As workplaces stabilize post-pandemic, April’s data shows that formal accountability processes are catching up in niche areas of Canada. HR professionals must:
- treat tribunal data as a leading risk metric
- strengthen internal resolution processes to reduce escalation
- embed sector-specific regulatory literacy into manager and staff training
4. Labour force
Overview: Canada’s labour force contracts slightly after steady gains
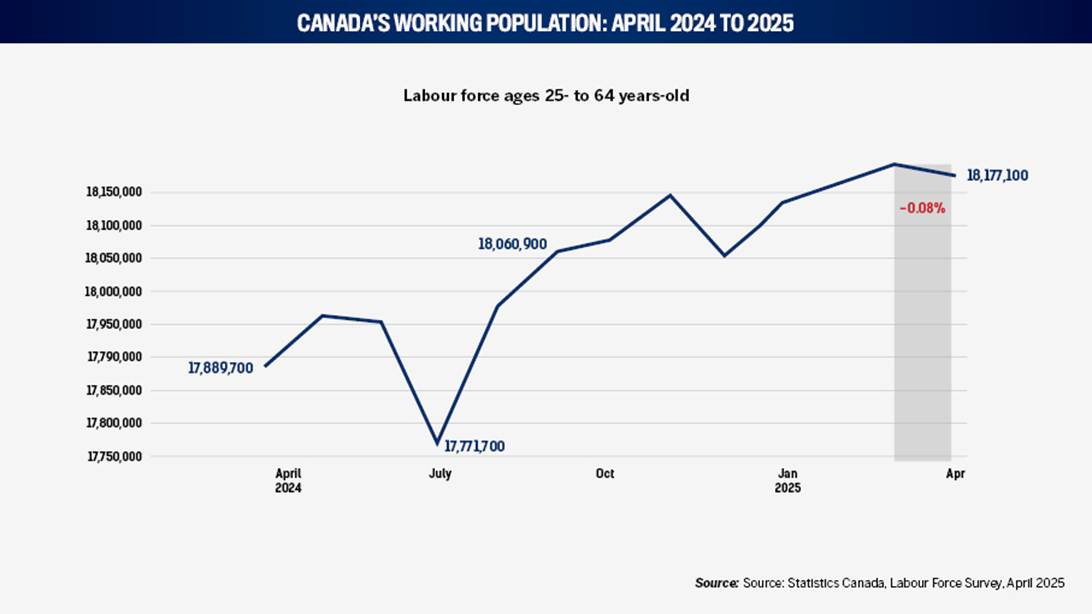
After a year highlighted by sustained expansion, Canada’s labour force (those working or looking for work) aged 25 to 64 years old contracted slightly in April 2025, slipping by 0.08 percent from March to 18,177,100. While this decline is modest in absolute terms, amounting to roughly 15,400 individuals, it marks a noteworthy inflection point as the second monthly decline during nearly 10 months of consecutive month-over-month labour force gains.
The 0.08 percent decline in April may be seasonal noise. But it could also reflect early retirements, less workforce participation among caregivers, or delayed re-entry into the workforce by certain demographics. This bears watching especially as wage growth has generally outpaced inflation, which typically draws more individuals into the labour market.
The slight contraction in labour supply underscores earlier mentioned importance of retention and workforce planning. Even small dips in the working population can compound recruitment challenges, particularly in sectors already struggling with high turnover, total job vacancies, or wage competition. Taken with tenure trends, a softening labour market is a cue to revisit employer value propositions. If workers begin opting out of the Canadian labour force, increasing onus will fall on employers to pull them back in.
Provinces: Growth strongest in Quebec, Manitoba, and Alberta
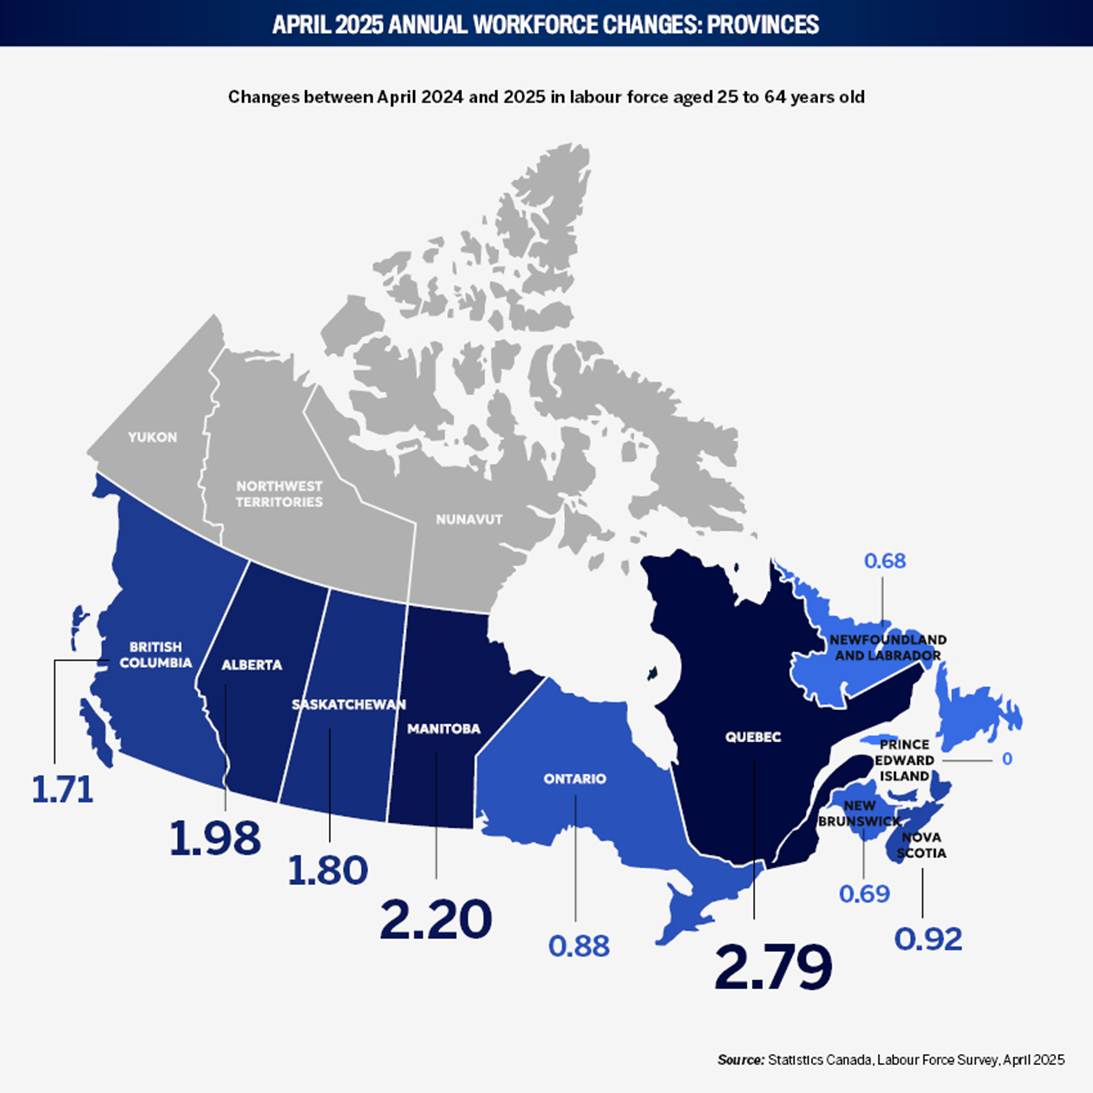
In the 12 months to April 2025, Canada’s labour force grew unevenly across the provinces. Quebec leads the way at 2.8 percent growth, adding 108,000 workers to reach a total workforce of 3.98 million. There, immigration has led to record population growth throughout Quebec City, Laval, and the Outaouais. Manitoba posted the second-highest growth rate, expanding its labour force by 2.2 percent to 612,900. Alberta, with a 1.98 percent increase, added 43,400 workers to reach 2.24 million total.
Saskatchewan (+1.8 percent) and BC (+1.7 percent) followed. Ontario, Canada’s most populous province, saw more modest growth of 1.1 percent, adding 42,000 to reach 3.92 million. Eastern provinces showed weaker expansion, with Prince Edward Island posting no growth and Newfoundland and Labrador gaining just 1,500 workers.
These trends reinforce the need for regionally tailored talent strategies. With strong workforce growth concentrated in select provinces, national employers should consider decentralized recruitment pipelines. Regional ones must compete more aggressively to retain local talent and duly consider the challenges of living and working across different provinces.
Cities: Urban labour growth surges in Winnipeg, Moncton, and Montréal
Canada’s major cities posted some of the most impressive labour force expansions over the past year, often outpacing their provincial averages.
Winnipeg leads all cities with a remarkable 5.6 percent YOY workforce increase, adding 28,800 people in April to reach 539,300. This is more than double Manitoba’s provincial growth rate (2.2 percent), suggesting that the capital is drawing in workers from smaller towns or other provinces. For HR professionals, this strengthens Winnipeg’s profile as a rising recruitment hub in the Prairies.
Similarly, Moncton, New Brunswick, grew its workforce by 5.4 percent. With 5,400 new entrants, the city now supports 104,700 workers. This shows that targeted investments in logistics and tech are paying dividends. For instance, Greystone Energy Systems, a Moncton-based manufacturer of HVAC sensors and transmitters, received $280,000 in payroll rebates from Opportunities NB to support workforce expansion between 2022 and 2025. Moncton’s growth contrasts sharply with New Brunswick’s overall moderate pace, reinforcing its role as a regional economic engine.
Montréal, Calgary, and Toronto also posted strong gains: 4.4 percent, 4.0 percent, and 3.8 percent, respectively. In April, Montréal, Quebec, added 107,100 workers – the lion’s share of the province’s entire gain. This underscore’s the cities magnetism for both new immigrants and interprovincial migrants.
For employers, domineering growth in the urban workforce highlights a need to double down on city-focused hiring strategies, even in smaller provinces with tepid overall growth, such as New Brunswick.
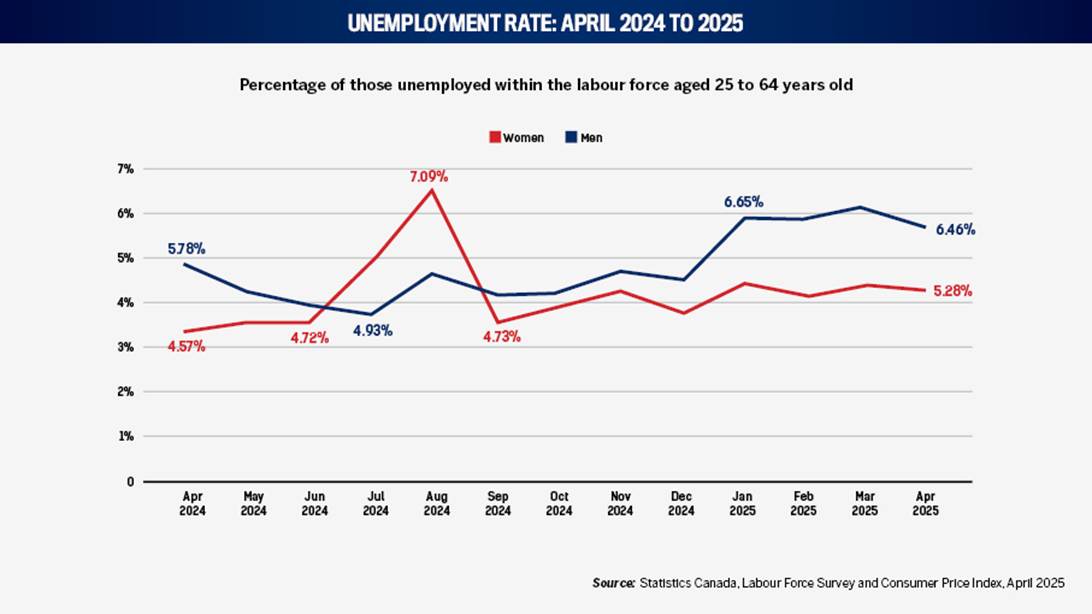
In April 2025, Canada’s unemployment rate showed minor but noteworthy differences across gender lines. Unemployment among women held at 5.28 percent, while the rate for men edged slightly down to 6.46 percent. While both figures are lower than recent highs in January, the 1.18 percentage point gap between male and female unemployment remains wide by recent historical standards.
Tapering unemployment is consistent with the trimming of job vacancies examined above. Nevertheless, considering for one moment traditionally gendered sectors, the third consecutive month where the unemployment rate for men exceeded 6.4 percent suggests persistent friction in areas like construction, manufacturing, and transportation. Likewise, for women, the steadier rate near 5.3 percent could reflect stronger growth in healthcare, education, or administrative roles, among other industries.
For HR leaders, this persistent gap between men’s and women’s unemployment signals opportunity to tailored re-entry programs, particularly for men facing longer unemployment durations in cyclical industries. Meanwhile, sectors employing more women should prepare for retention pressure or reject stratification as those workers remain in higher demand.
Age groups: Youth and late-career workers hit hardest by rising unemployment
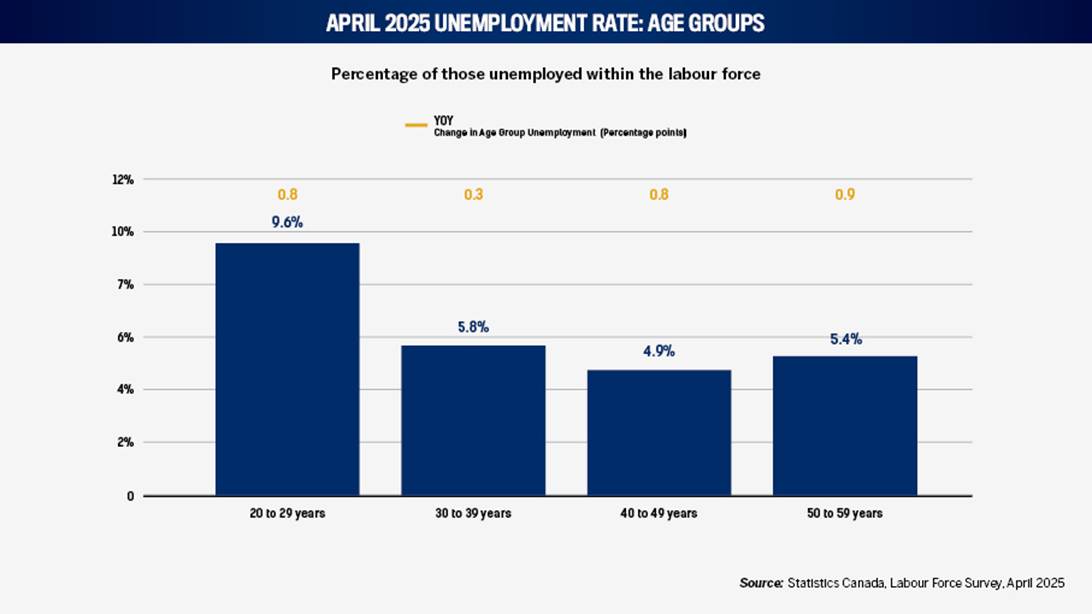
In April 2025, YOY unemployment rates climbed across all major working-age groups with the sharpest increases recorded among the youngest and oldest.
The 20–29 age group experienced the highest overall unemployment rate at nearly one-in-ten (9.6 percent), up 0.8 percentage points from the previous year. This reflects persistent volatility in early-career hiring, especially as typical entry-level roles in retail, food service, and entertainment remain vulnerable to automation, fewer vacancies, and low performance. Structured onboarding pathways and skills-based hiring are important to capture young talent striving to enter the workforce.
Surprisingly, the largest increase in unemployment was among 50–59-year-olds, rising nearly 1 percentage point to 5.4 percent. This month’s data may reflect lagging digital adaptation or age bias. Cost-saving layoffs, amid higher wages and vacancies, could be targeting senior staff. As experienced professionals are pushed out, HR must reconsider assumptions around productivity and succession planning, particularly in knowledge-based sectors.
Education attainment: Unemployment rises for educated workers, declines for less educated
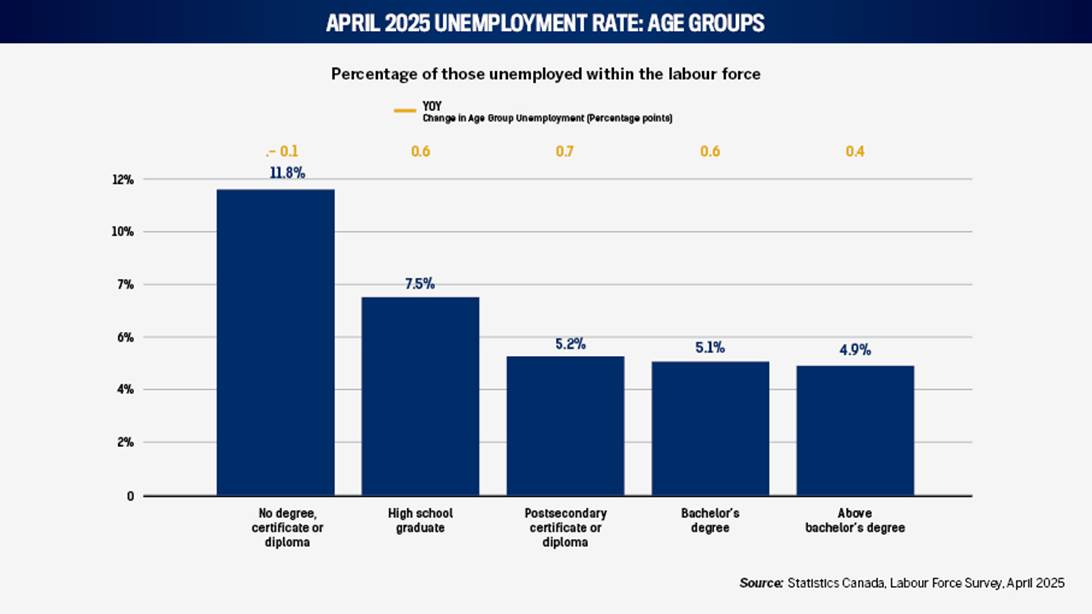
Canada’s April 2025 unemployment data show that although those without a degree or diploma remain the most likely to be unemployed, at 11.8 percent, they were the only group to experience a YOY decline in unemployment (-0.1 percentage points). This modest improvement suggests tight labour conditions in sectors like logistics, construction, and basic services.
In contrast, all other groups saw rising unemployment. College diploma holders experienced the sharpest increase, up 0.7 points to 5.2 percent, followed closely by bachelor’s degree holders, whose unemployment rate rose to 5.1 percent. Even those with graduate degrees weren’t immune, with a climb from 4.5 percent to 4.9 percent. This pattern points to a broader cooling in credential-heavy hiring, potentially linked to economic caution in the public sector, white-collar services, and tech as explained previously.
Talent at both ends of the education spectrum is increasingly available, but for different reasons. HR professionals should retool recruitment filters to consider experience and adaptability over degrees, as hiring for those without significant education increases YOY.


